Cell Options
This page guides us through different features and settings that could be applied to individual cells or ranges of cells to control their appearance, behavior, and data handling. These options include formatting, content to display, cell background and visibility and the icons.
Name
The Name for a cell options provide identity, facilitates communication, clarity and uniquness. It should be self-explanatory in the sense that it helps to identify how a cell would appear if this cell option is applied.
Description
Description helps to briefly explain what all a particular cell option does to a celll and how is it different from other cell options. Based on this brief explanation user can make his choice of which cell option to apply.
Calculations
MDC Grid gives the ability to have calculations on the provided measure values. These calculations can then be used to make decisions, such as, when to
- show a particular icon
- show a cell
- have a particular background color for a cell, or
- to show a particular content in a cell,
when certain calculations are met. These calculations can be simple or complex, involving basic arithmetic, functions, and references across cells.
Here’s a guide on how to perform and manage calculations in a grid:
1. Simple Arithmetic Operations
- Addition:
A + Badds the values of measures A and B. - Subtraction:
A - Bsubtracts the values of measures A and B. - Multiplication:
A * Bmultiplies the values of measures A and B. - Division:
A / Bdivides the value of measures A and B.
2. Comparison
- Equals:
A == Bchecks whether the measure values are equal, return true or false. - Does not Equal:
A != Bchecks whether the measure values are not equal, return true or false. - Less than:
A < Bchecks whether the measure value of A is less than than that of B, return true or false. - Less than or equal to:
A <= Bchecks whether the measure value of A is less than or equal to than than of B, return true or false. - Greater than:
A > Bchecks whether the measure value of A is greater than than that of B, return true or false. - Greater than or equal to:
A >= Bchecks whether the measure value of A is greater than than that of B, return true or false.
3. Boolean logic
- OR:
A or Bchecks for Boolean or. - AND:
A and Bchecks for Boolean and. - NOT:
not Bchecks for Boolean not.
4. Built-in functions
- abs(x): Absolute value
- ceil(x): Round floating point up
- empty(x): True if x is
undefined,null, an empty array or an empty string - exists(x): True unless x is
undefinedornull - floor(x): Round floating point down
- log(x): Natural logarithm
- log2(x): Logarithm base two
- log10(x): Logarithm base ten
- max(a, b, c…): Max value (variable length of args)
- min(a, b, c…): Min value (variable length of args)
- round(x): Round floating point
- sqrt(x): Square root
Conditional Expressions
When writing expressions in Markdown, you can use triggers to show a list of keywords that you can select and mention in the Markdown. There are two types of keywords:
- Reserved Keywords, and
- Measures & Calculations
Example
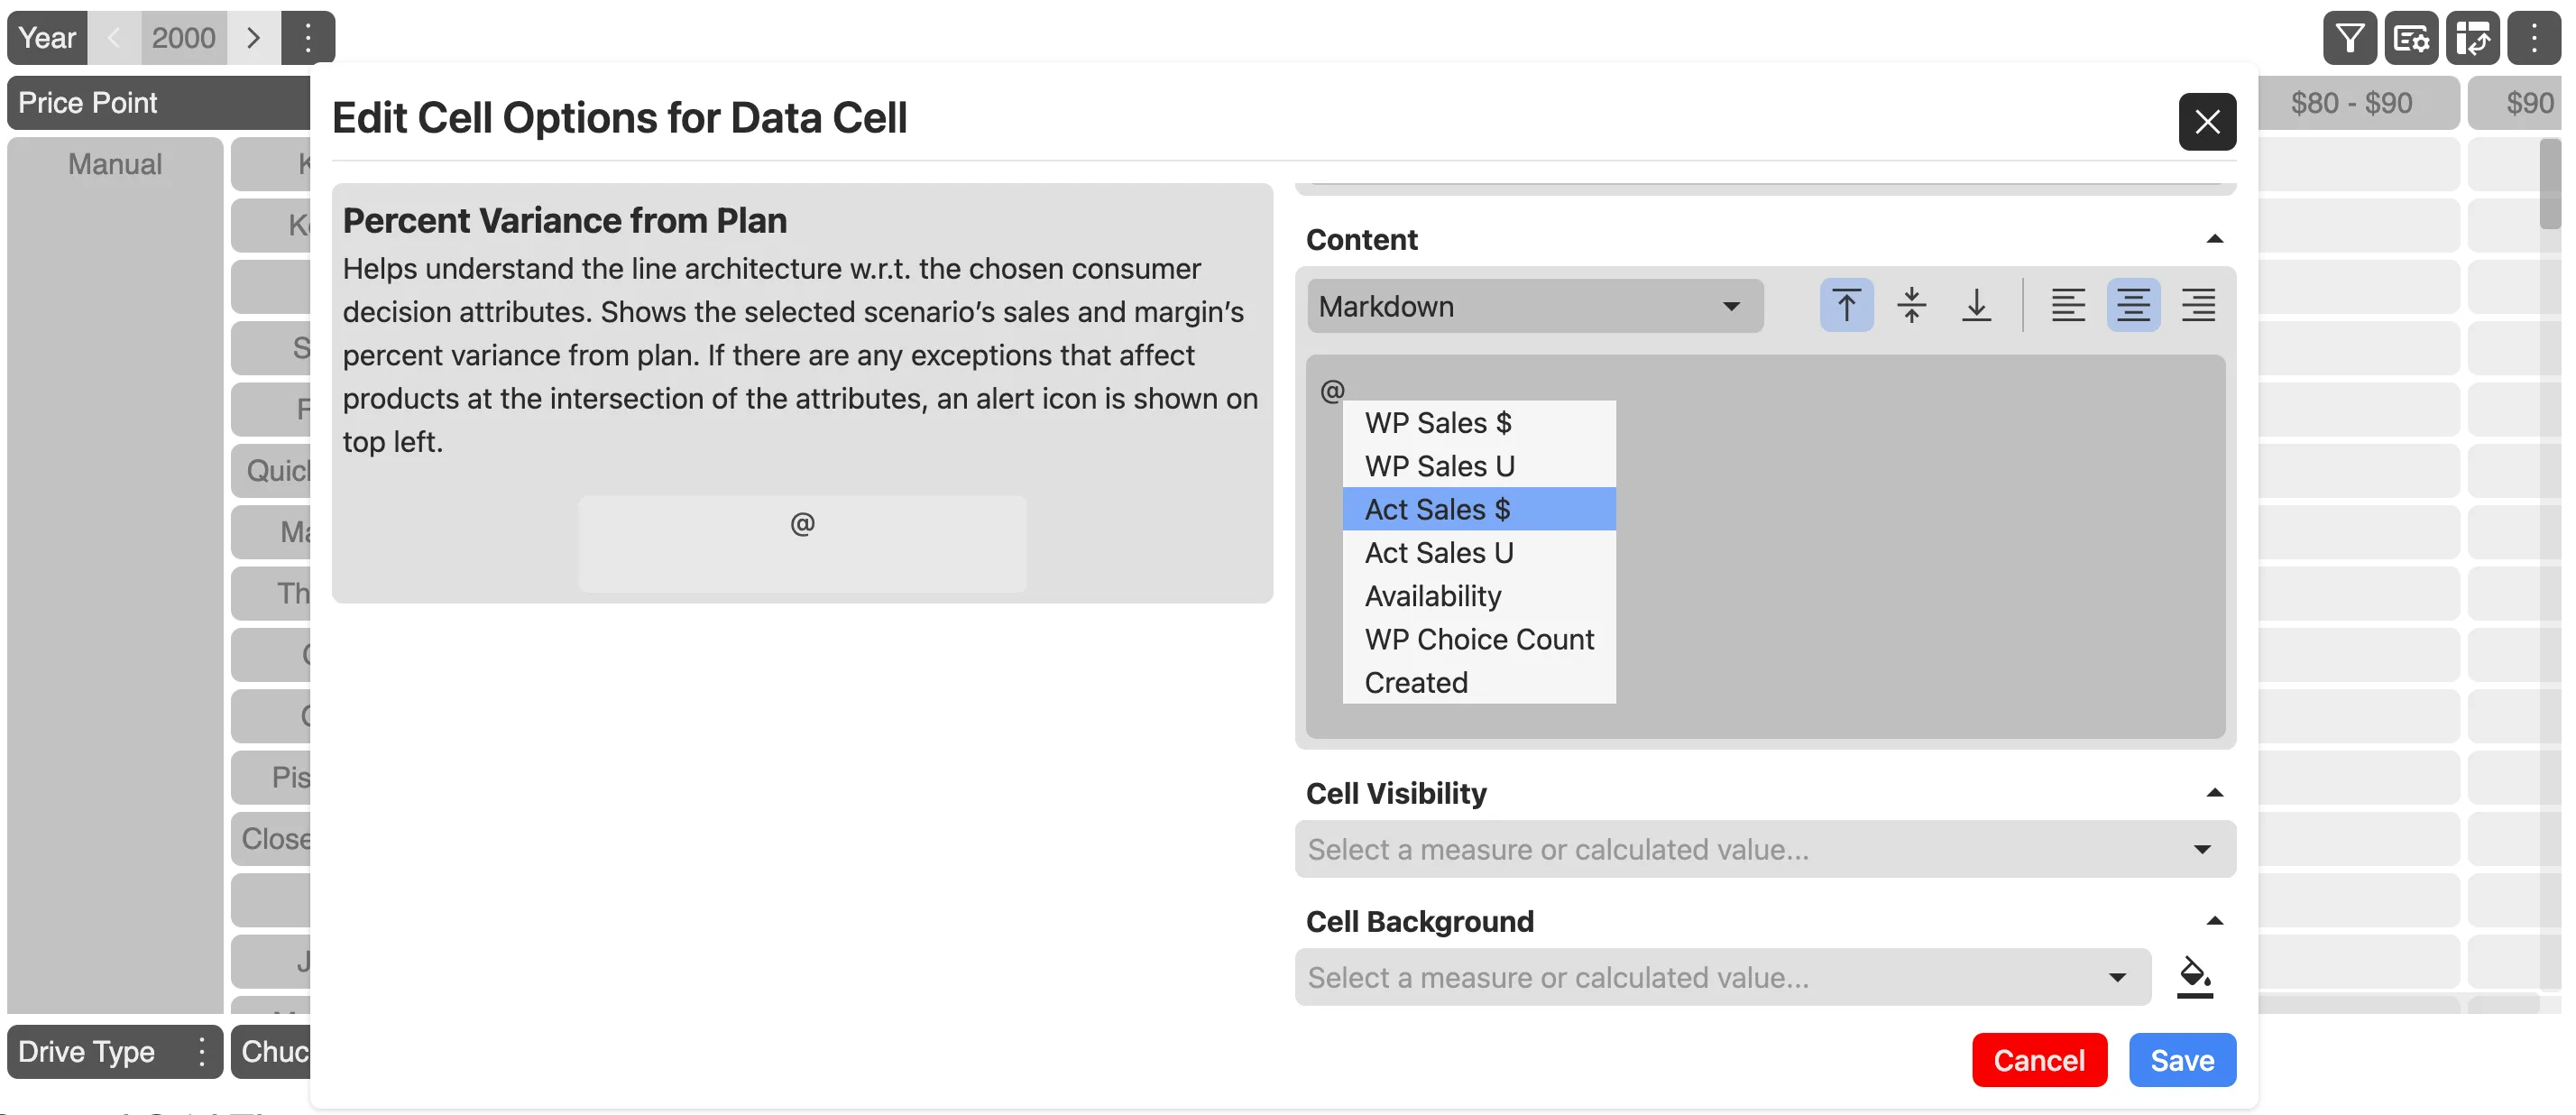
Say you want to mention a measure or a calculation; you press the @ key, and it shows a list of measures and calculations available. Now you can select a Measure or a Calculation.
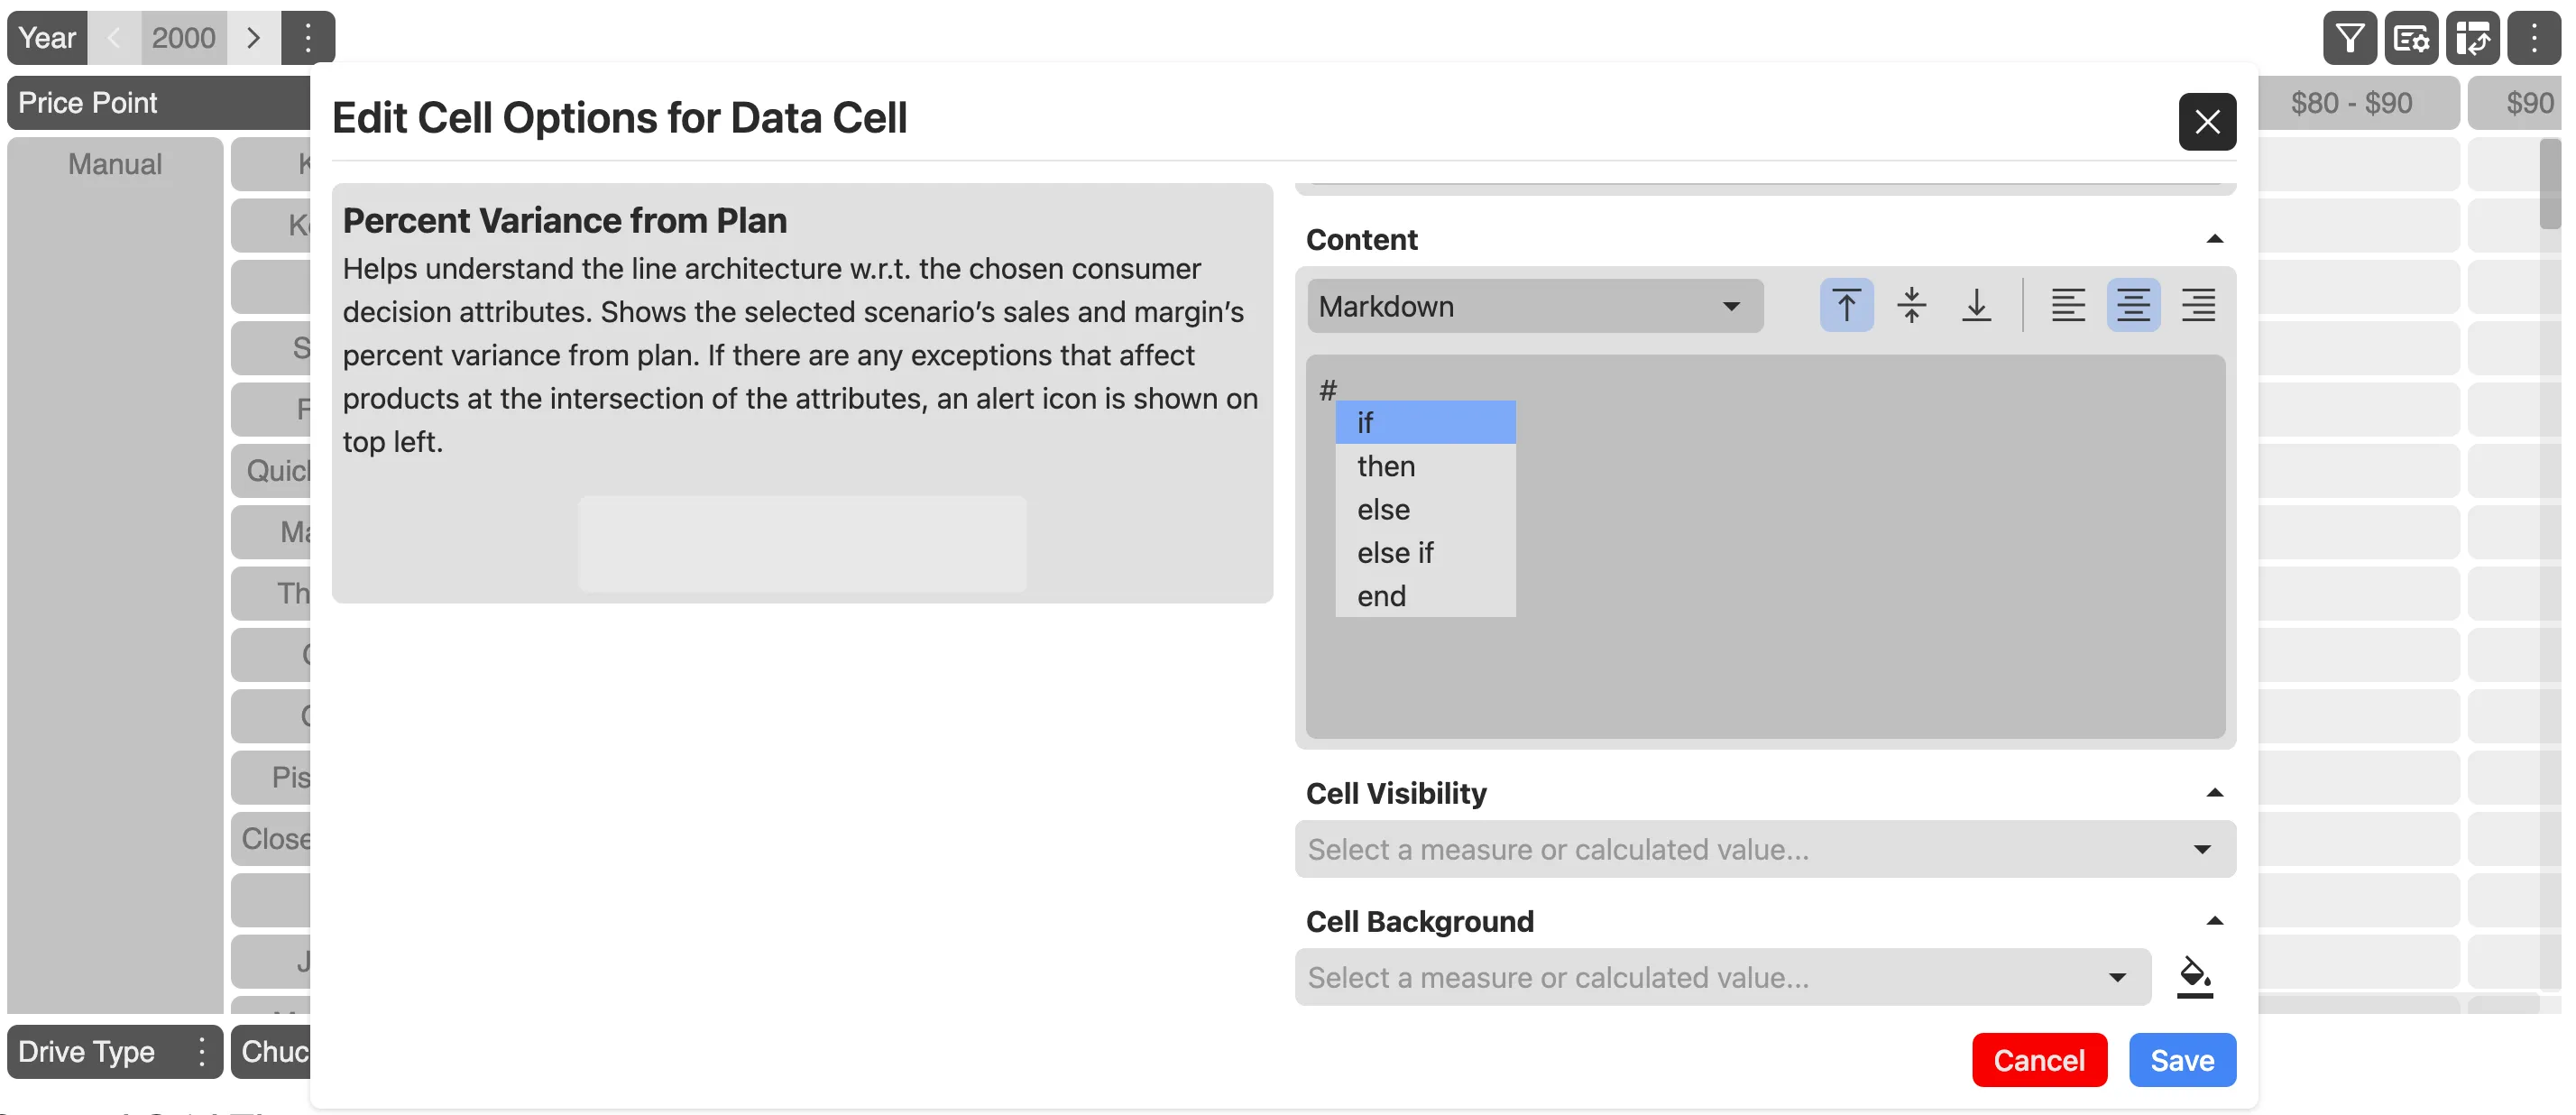
Similarly, if you want to use a reserved keyword, you press the # key, and it shows a list of reserved keywords.
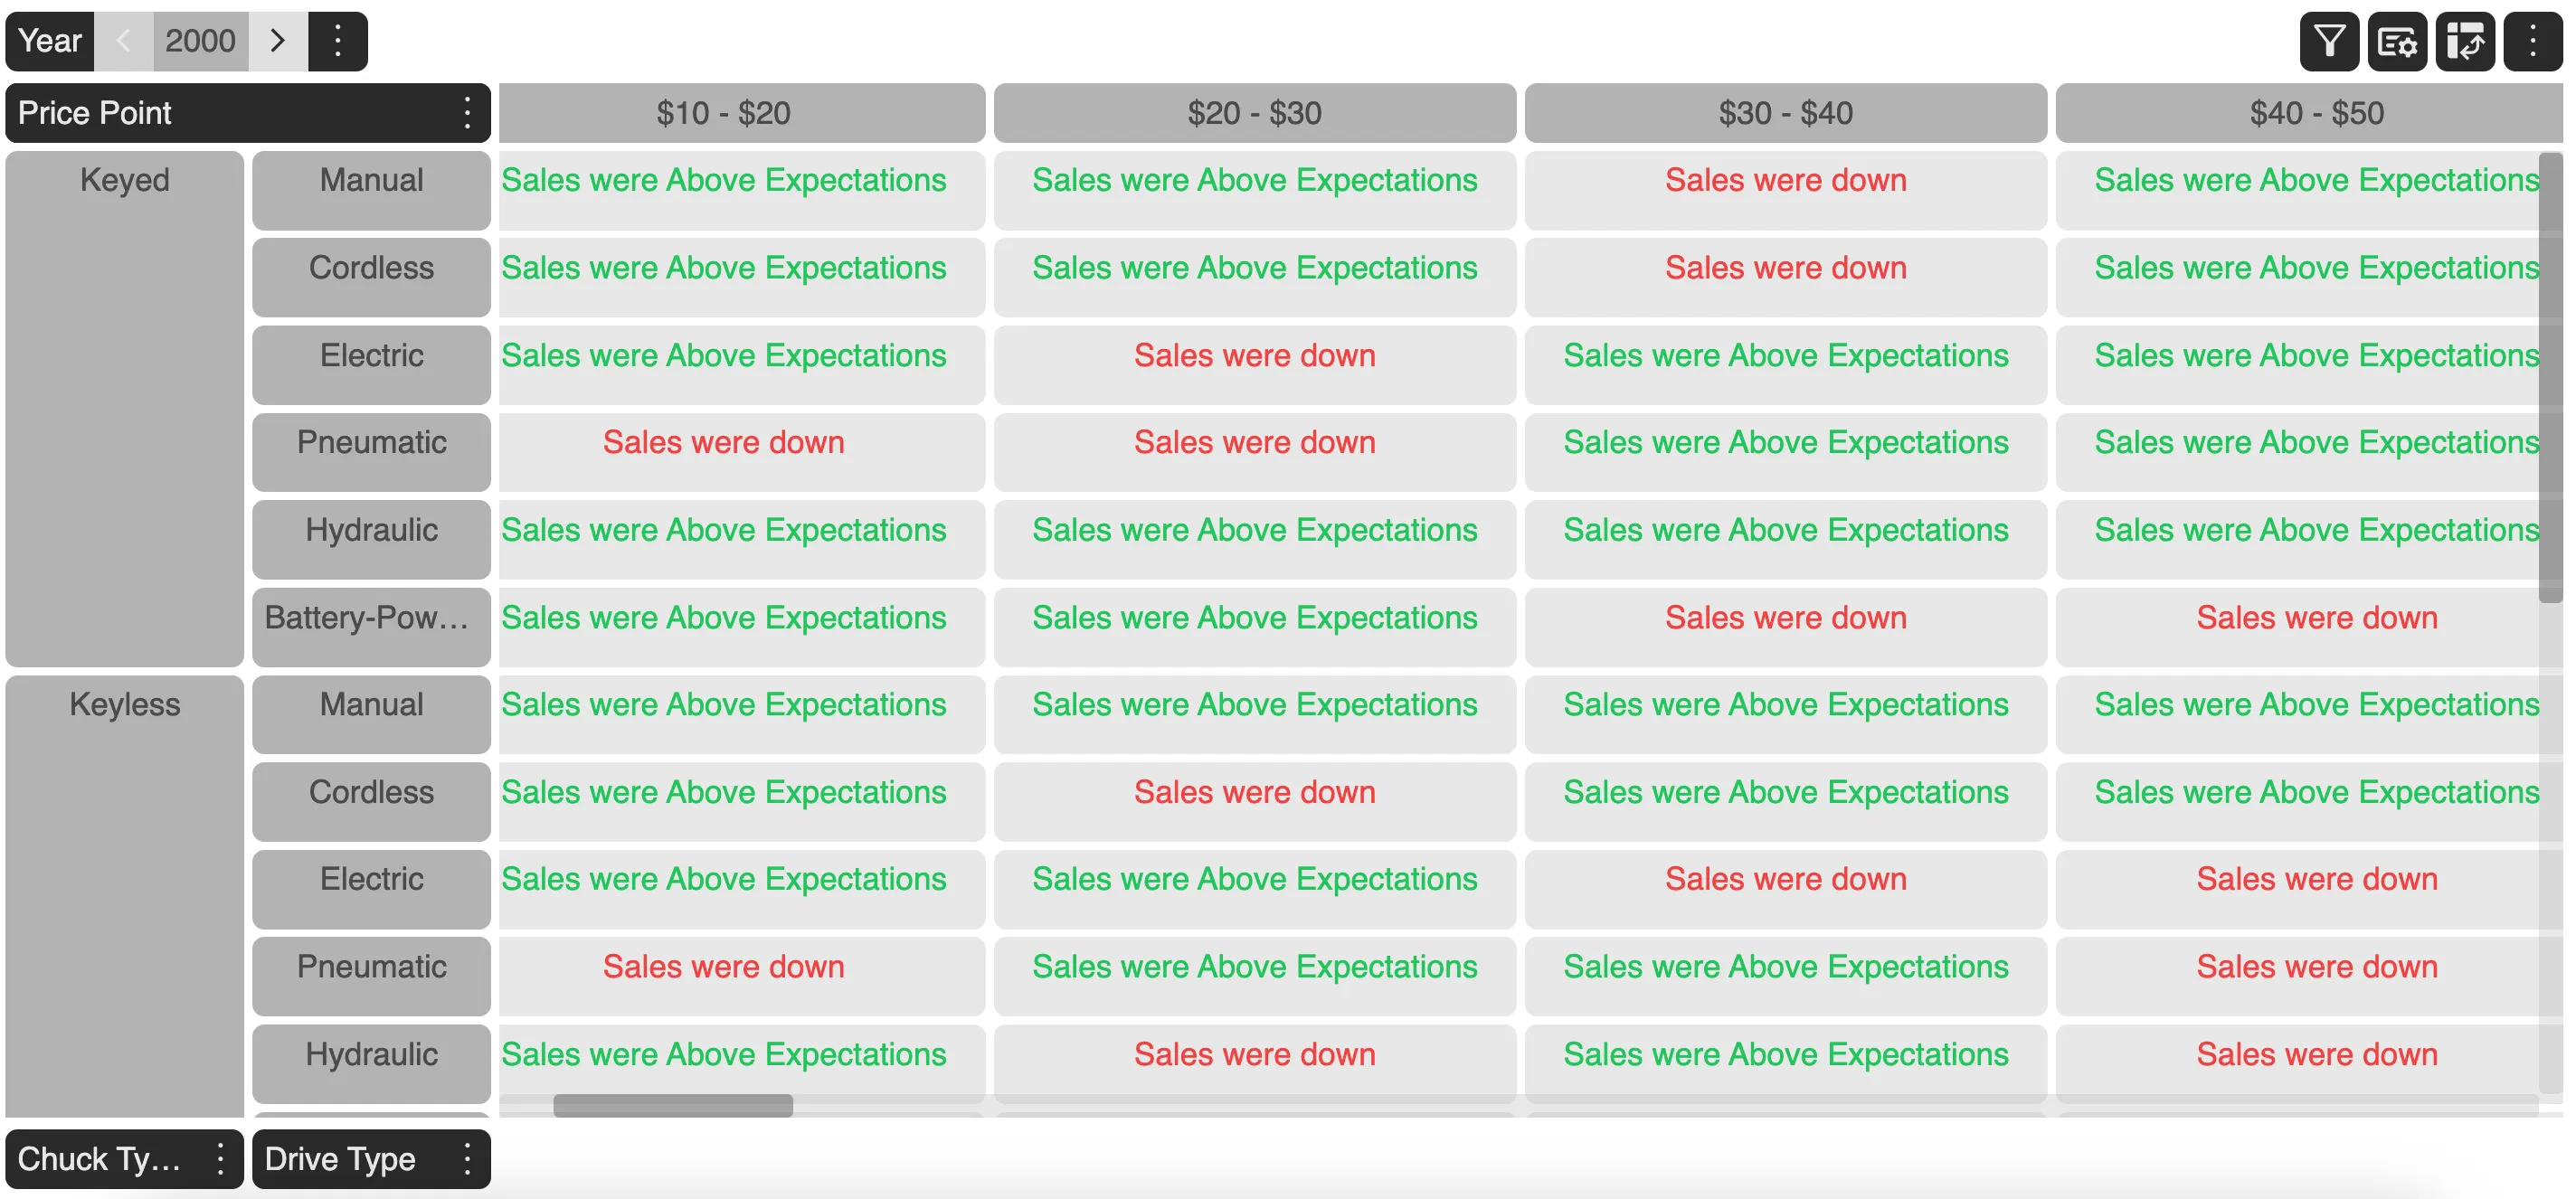
Expression:
if Act Sales U > 150 then "<span class='text-green-500'>Sales were Above Expectations</span>" else "<span class='text-red-500'>Sales were down</span>" end.
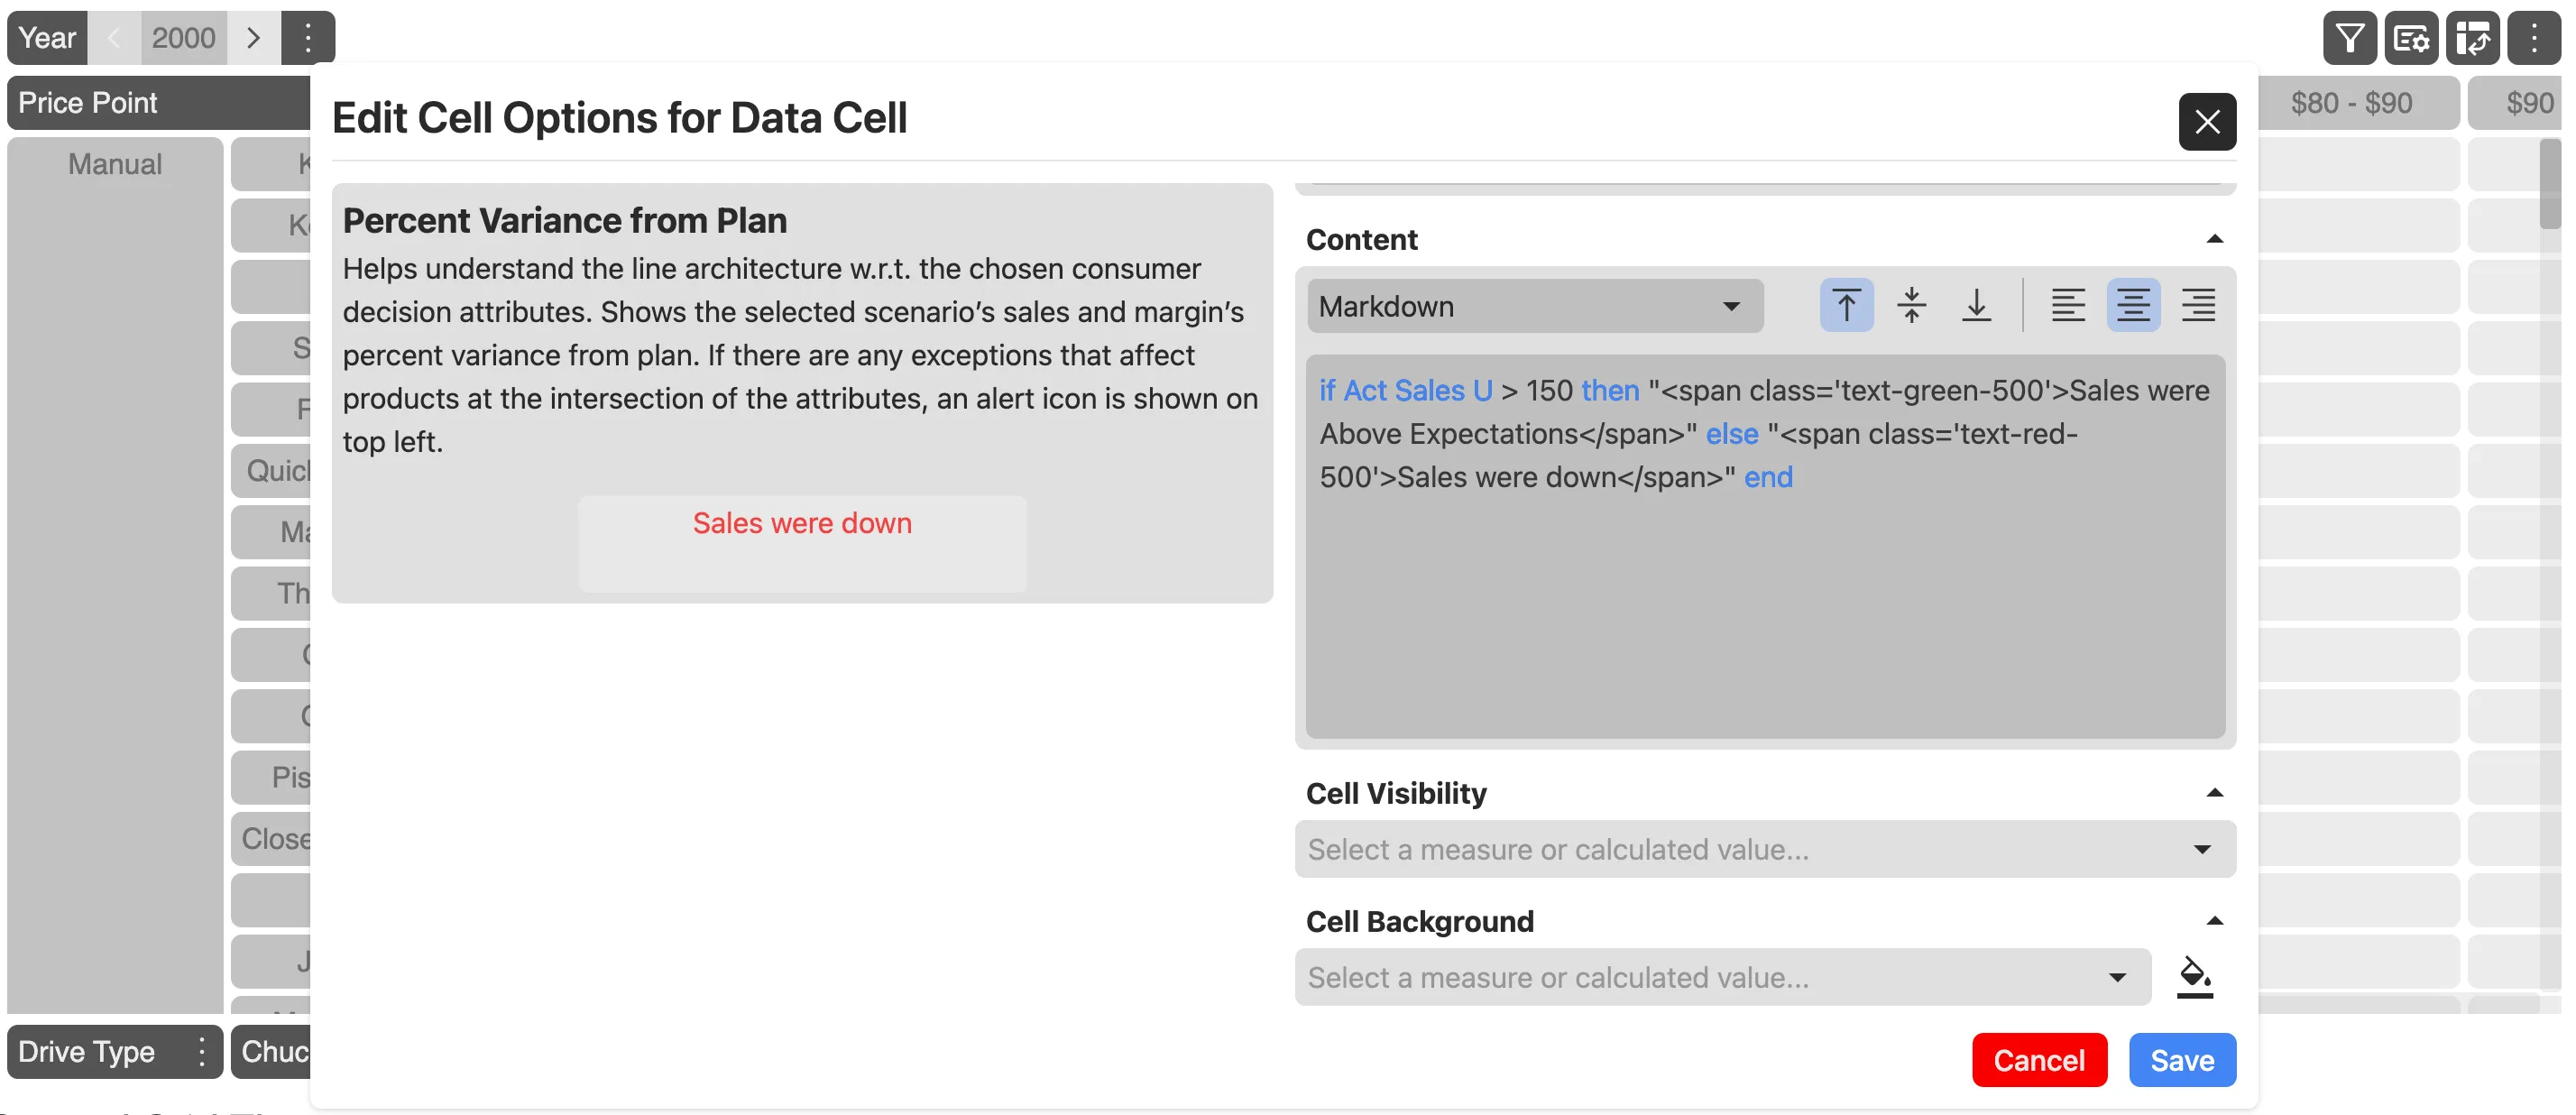
Grid Preview
Triggers
| Keyword | Description |
|---|---|
| # | Shows a list of reserved keywords for conditions. |
| @ | Shows a list of available Measures and Calculations. |
Reserved Keywords
| Keyword | Description |
|---|---|
| if | Starts a condition. |
| then | Specifies the expression to execute for if and else if conditions. |
| else if | Specifies the expression to execute if the preceding if or previous else if condition is false. |
| else | Specifies the code to execute if the preceding if or else if condition is false. |
| end | Specifies the end of a statement. |
Expressions in Markdown
Expressions in Markdown provide users the ability to insert conditional statements into their Markdown text, allowing for dynamic content generation based on specified conditions.
Basic Example
Case: Calculate how much tax John Doe has to pay depending on his salary.
Markdown Text :
John Doe has to pay if salary > 500000 then "15%" else "10%" end tax.
Values: salary = 400000
Result: John Doe has to pay 10% tax
Syntax
Here’s a simplified breakdown of the syntax structure for the statements.
Basic Structure
/*  if  else  statement  */

if <condition1>   return <expression1>else   return <expression2>end

/*  if  else  if  statement  */
if <condition1>   return <expression1>else  if <condition2>   return <expression2>else   return <expression3>end

/*  nested  statement  */
if <condition1> return <expression1>else if <condition2> return <expression2>else if <nestedCondition1> return <nestedExpression1> else if <nestedCondition2> return <nestedExpression2> else return <nestedExpression3>end-
if,else if, andelseare keywords indicating different branches based on conditions. -
<condition>represents the logical condition to be evaluated. -
<expression>represents the action or value returned based on the condition. -
endmarks the end of the conditional block.
Note: Nested if and else if conditions are supported without the need for an end keyword.
Example
Statement:
if a mod 2 == 0 then if a == 2 then "a equals 2" else "a is a multiple of 2" else if a == 1 then "a equal 1" else "a is not an even number" end.
The given statement can be viewed as:
if (a mod 2 == 0) then if (a == 2) then return "a equals 2" else return "a is a multiple of 2"else if (a == 1) then return "a equal 1"else return "a is not an even number"end- This example demonstrates nested
if-elseconditions to determine the output based on the value of variablea.
Let’s break down the given condition step by step:
- Let’s assume
a= 10.
- First we find out the modulo and compare the result to 0.
let x = a mod 2 => 10 mod 2 => 0;As x is 0, the condition a mod 2 == 0 is true.
- As condition
a mod 2 == 0is true, we check the nestedifconditiona == 2.
let y = a == 2 => 10 == 2 => false;- Now the condition
a == 2is false, we return else expression.
Result: a is a multiple of 2.
- Let’s assume
a= 15.
- First we find out the modulo and compare the result to 0:
let x = a mod 2 => 15 mod 2 => 1;As x is 1, the condition a mod 2 == 0 is false.
- As condition
a mod 2 == 0is false, we checkelse ifconditiona == 1:
let y = a == 1 => 15 == 1 => false;- Now else if condition
a == 1is false, we returnelseexpression.
Result: a is not an even number.
Operators
We can use different operators. There are arithmetic operators, comparison operators, boolean logical operators, object & arrays and built in functions. Check the tables given below for more information about different operators.
Arithmetic Operators
| Numeric arithmetic | Description |
|---|---|
| x + y | Add |
| x - y | Subtract |
| x * y | Multiply |
| x / y | Divide |
| x ^ y | Power |
| x mod y | Modulo |
Note! Modulo always returns a positive number: -1 mod 3 == 2. when using Modulo operator specify comparison: 10 mod 2 will throw inside conditions.
Comparison Operators
| Comparisons | Description |
|---|---|
x == y | Equals |
x != y | Does not equal |
x < y | Less than |
x <= y | Less than or equal to |
x > y | Greater than |
x >= y | Greater than or equal to |
x == y <= z | Chained relation, equivalent to (x == y and y <= z) |
x ~= y | Regular expression match |
x in (a, b, c) | Equivalent to (x == a or x == b or x == c) |
x not in (a, b, c) | Equivalent to (x != a and x != b and x != c) |
Boolean Logical Operators
| Boolean logic | Description |
|---|---|
| x or y | Boolean or |
| x and y | Boolean and |
| not x | Boolean not |
| if x then y else z | If boolean x is true, return value y, else return z |
| ( x ) | Explicity operator precedence |
Object and arrays
| Objects and arrays | Description |
|---|---|
| (a, b, c) | Array |
| a in b | Array a is a subset of array b |
| x of y | Property x of object y |
Built-in Functions
| Built-in functions | Description |
|---|---|
| abs(x) | Absolute value |
| ceil(x) | Round floating point up |
| empty(x) | True if x is undefined, null, an empty array or an empty string |
| exists(x) | True unless x is undefined or null |
| floor(x) | Round floating point down |
| log(x) | Natural logarithm |
| log2(x) | Logarithm base two |
| log10(x) | Logarithm base ten |
| max(a, b, c…) | Max value (variable length of args) |
| min(a, b, c…) | Min value (variable length of args) |
| round(x) | Round floating point |
| sqrt(x) | Square root |
Expressions
There are 5 types of Expressions: numbers, strings, booleans and arrays & objects of these. Numbers may be floating point or integers. The properties of an object can be accessed using the of operator. Types don’t get automatically converted: 1 + true isn’t two, but an error.
| Values | Description |
|---|---|
| 43, -1.234 | Numbers |
| ”hello” | String |
| ” \” \\ “ | Escaping of double-quotes and backslash in string |
More Examples
- Statement:
if a > 2 then true else false end.
values: a = 10.
Result: true.
- Statement:
if a > b then "a is greater than b" else "a is smaller than b" end.
values: a = 10 , b = 20.
Result: a is greater than b.
- Statement:
if a > 2 then true else if a < 0 then "Negative Value" else false end.
values: a = -1.
Result: “Negative Value”.
- Statement:
if a mod 2 == 0 then if a == 2 then "a equals 2" else "a is a multiple of 2" else if a == 1 then "a equal 1" else "a is not an even number" end.
- values: a = 11
Result: a is not an even number.
- Values: a = 12
Result: a is a multiple of 2.
- Statement:
if a > 0 then "a is a positive number" else if a < 0 then "a is a negative number" else "a is zero" end.
- values: a = 11
Result: a is a positive number.
- Values: a = 12.
Result: a is negative number.
- Statement:
if a % 3 == 0 then if a % 5 == 0 then "a is divisible by both 3 and 5" else "a is divisible by 3 but not by 5" end else if a % 5 == 0 then "a is divisible by 5 but not by 3" else "a is not divisible by either 3 or 5" end.
- Values: a = 15.
Result: a is divisible by both 3 and 5.
- Values: a = 12.
Result: a is divisible by 3 but not by 5.
- Values: a = 25.
Result: a is divisible by 5 but not by 3.
- Values: a = 7.
Result: a is not divisible by either 3 or 5.
- Statement:
if salesToday > salesYesterday then "We made more profit today." else "Sales were not good today."
- Values: salesToday = 50000, salesYesterday = 40000
Result: We made more profit today.
- Values: salesToday = 30000, salesYesterday = 40000
Result: Sales were not good today.
Measure Formats
Measure format helps the user to format certain measure values differently than other, in order to highlight certain key aspects of that measure. For example, if a measure value is greater than 100, then to show it in green color versus showing it in red color when it below 100.
The value of a measure displayed in a cell could be formatted in the following manner:
- Bold
- Italic
- Color - static or conditional color
- Value formatting - either fixed or custom
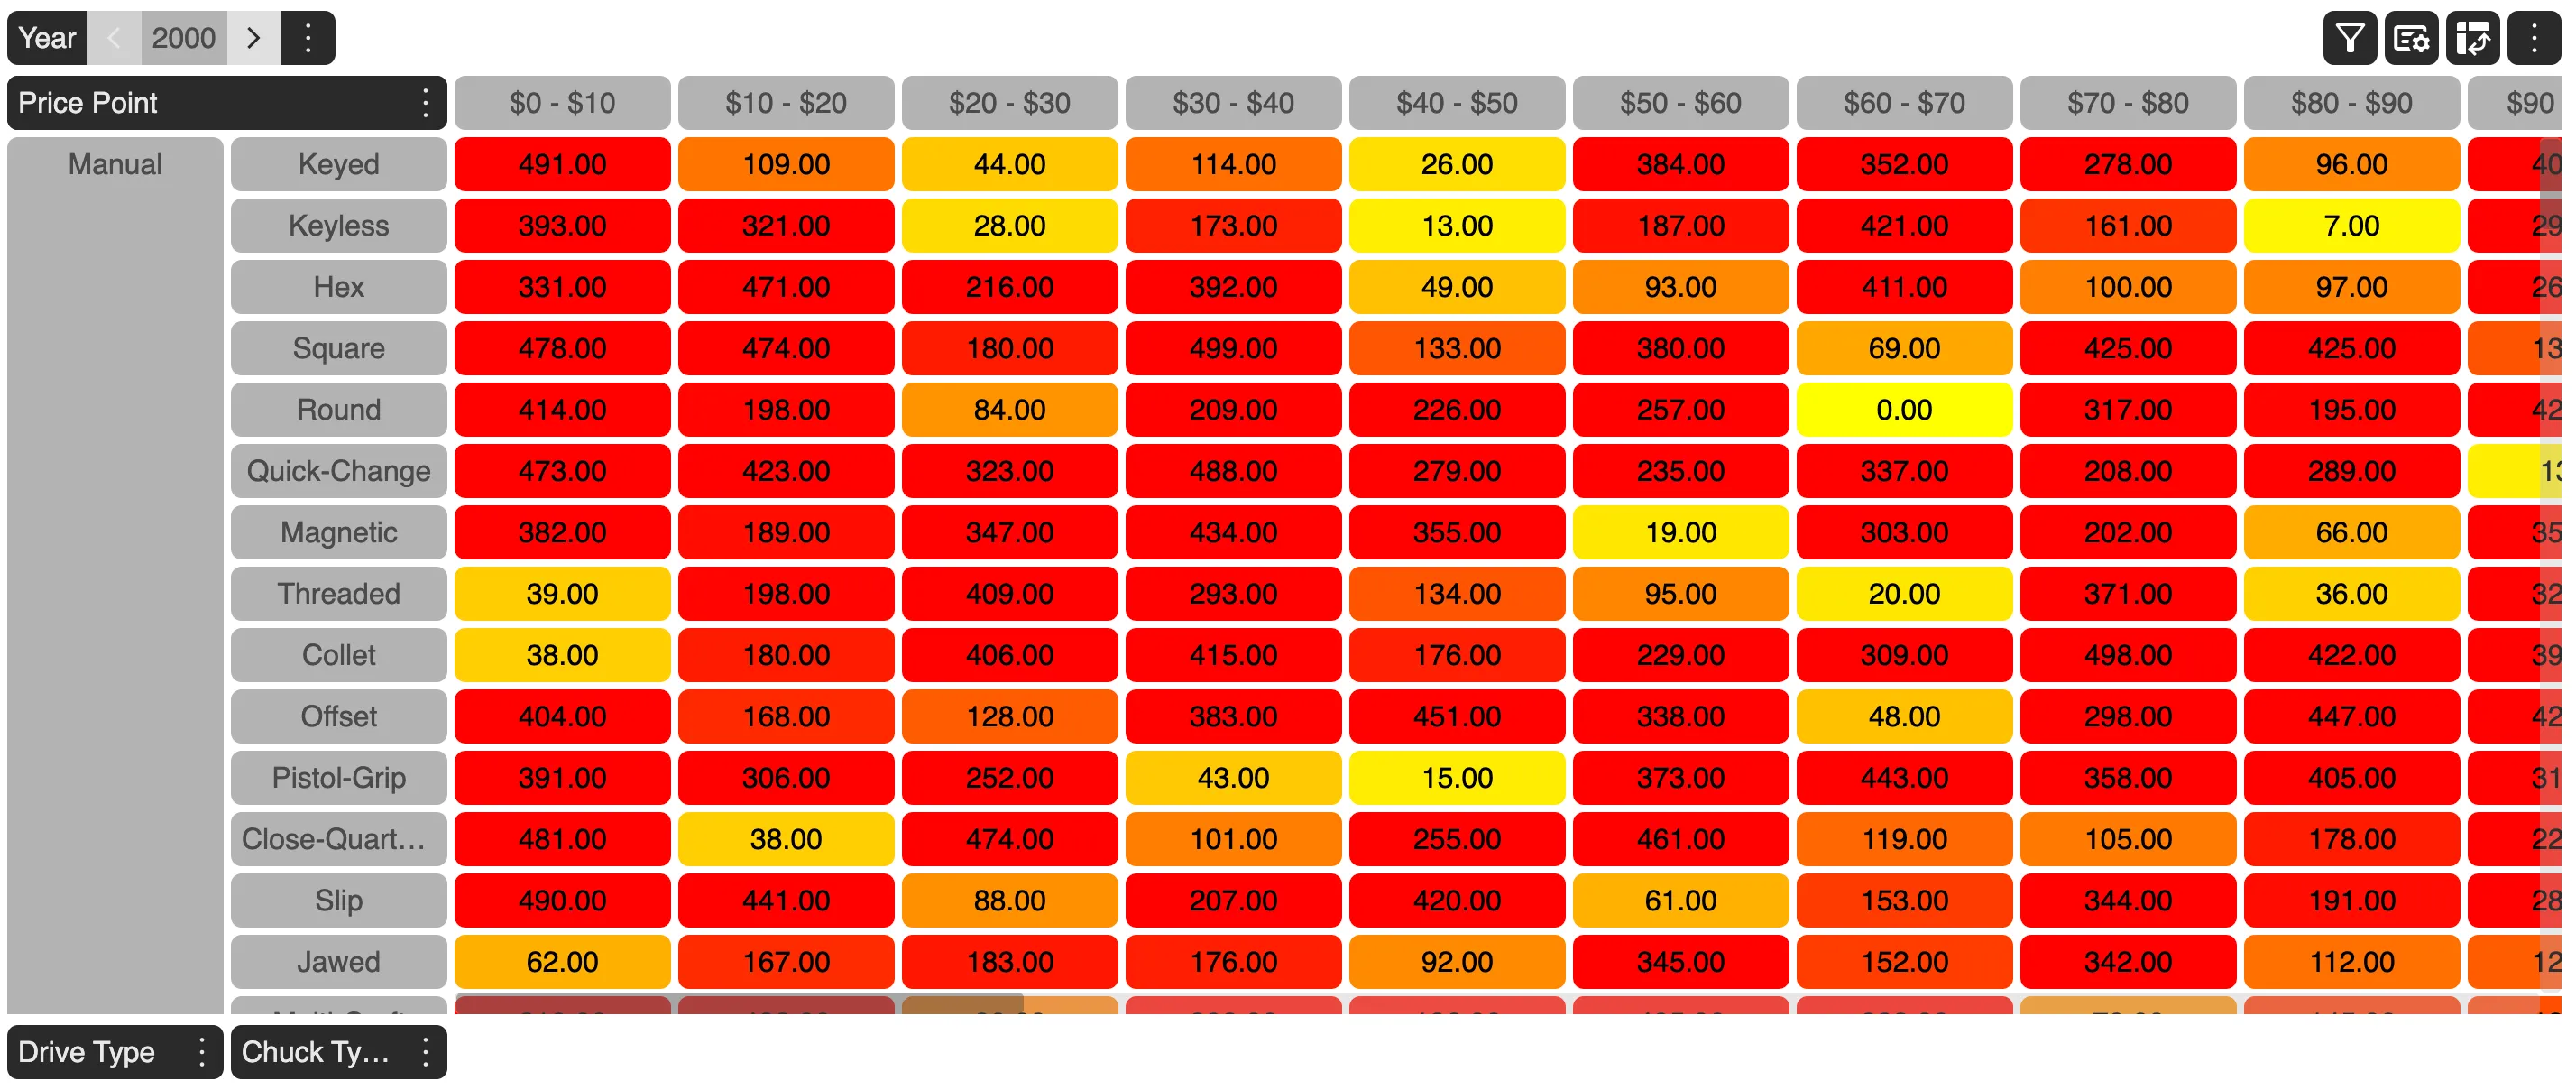
Conditional formatting
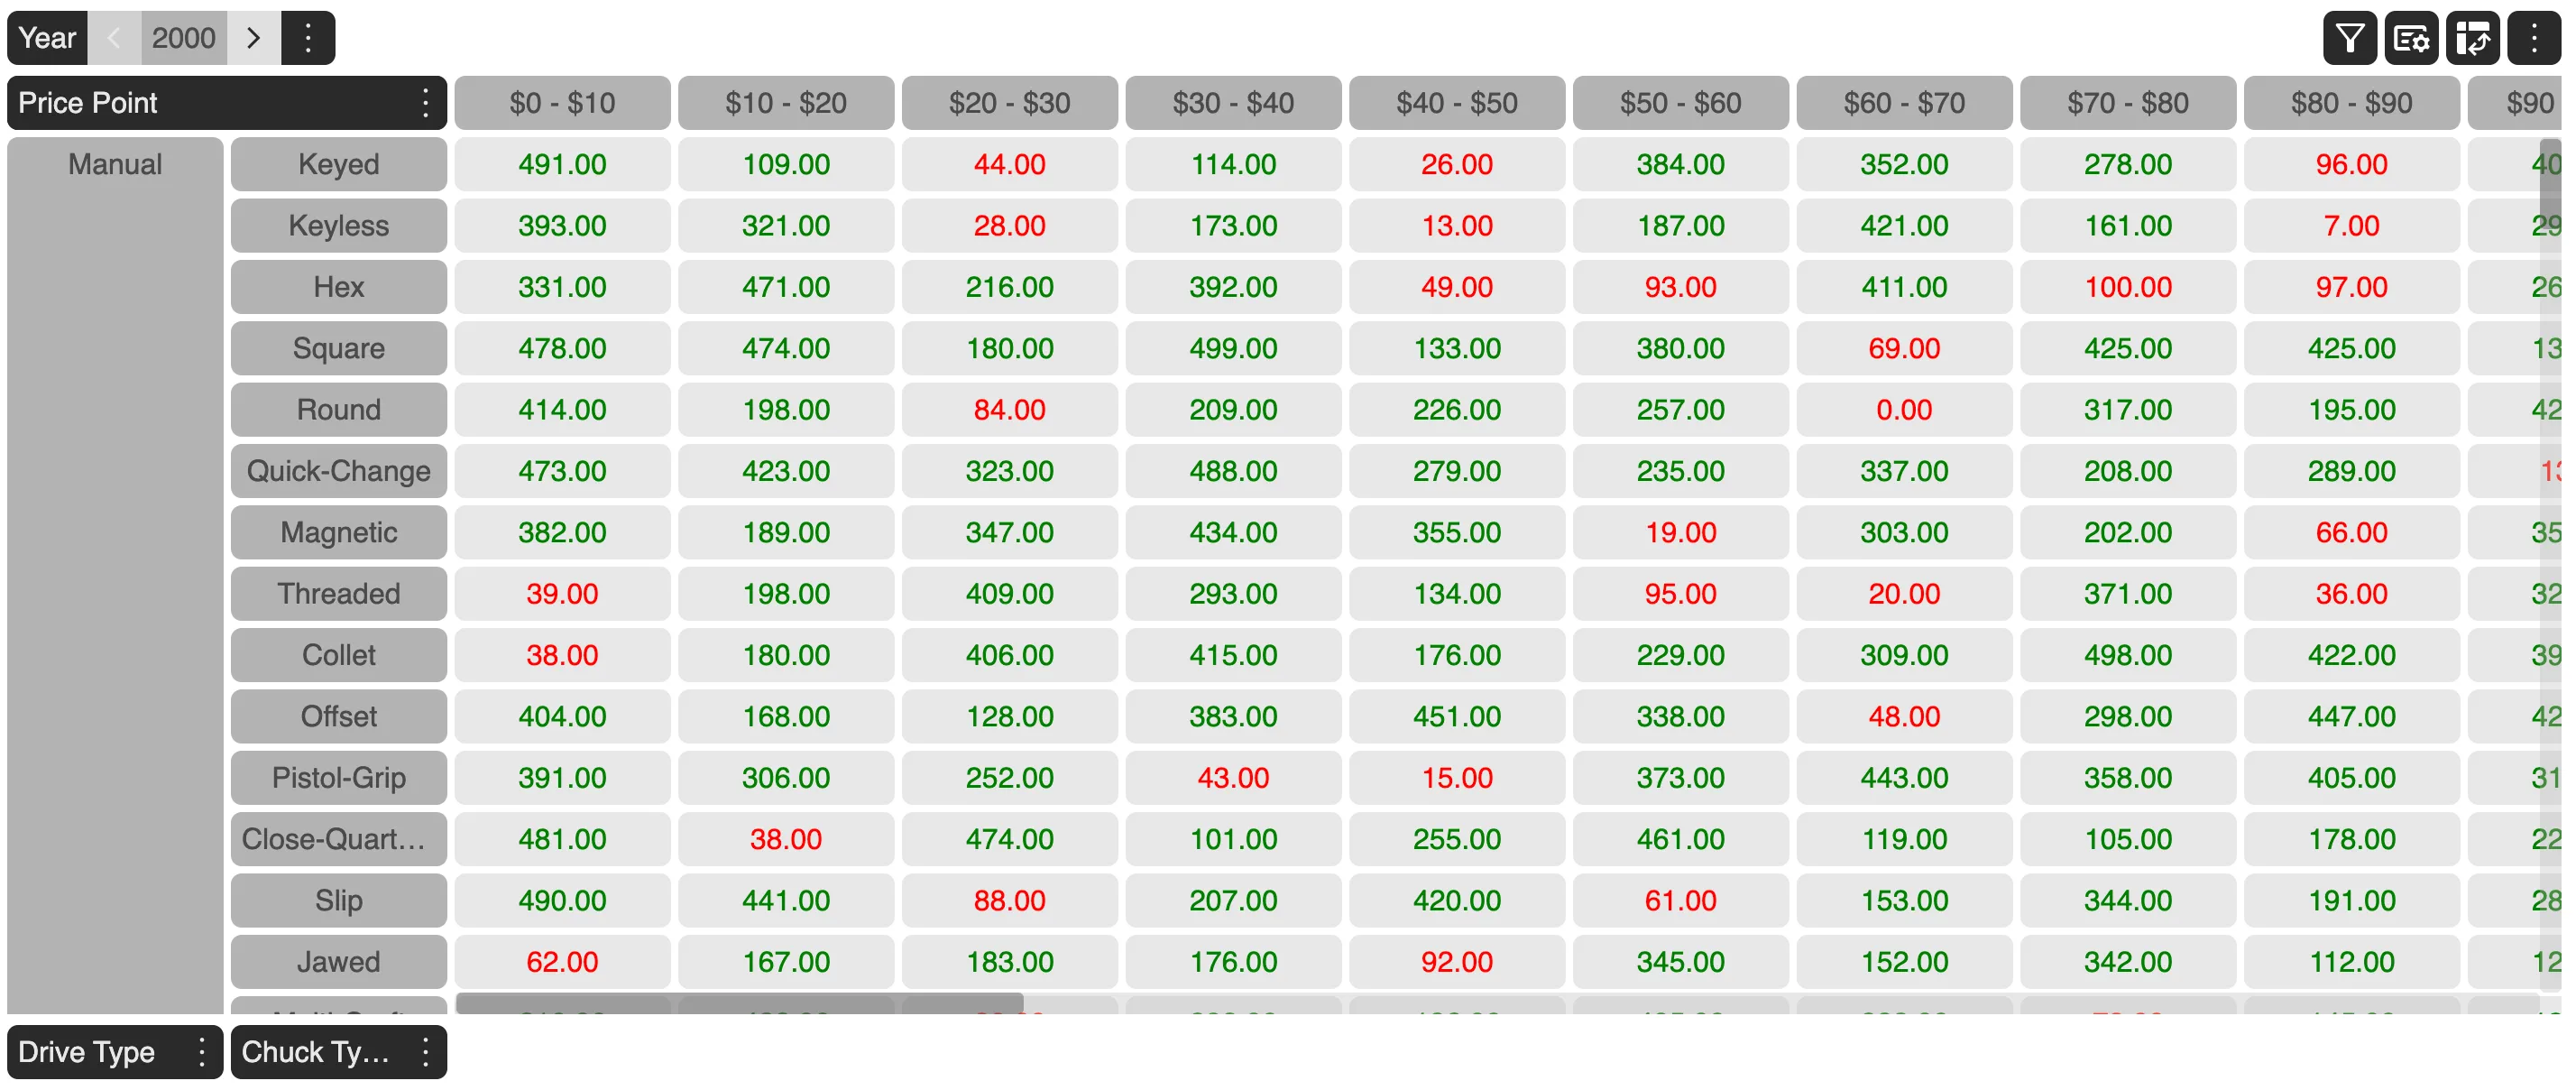
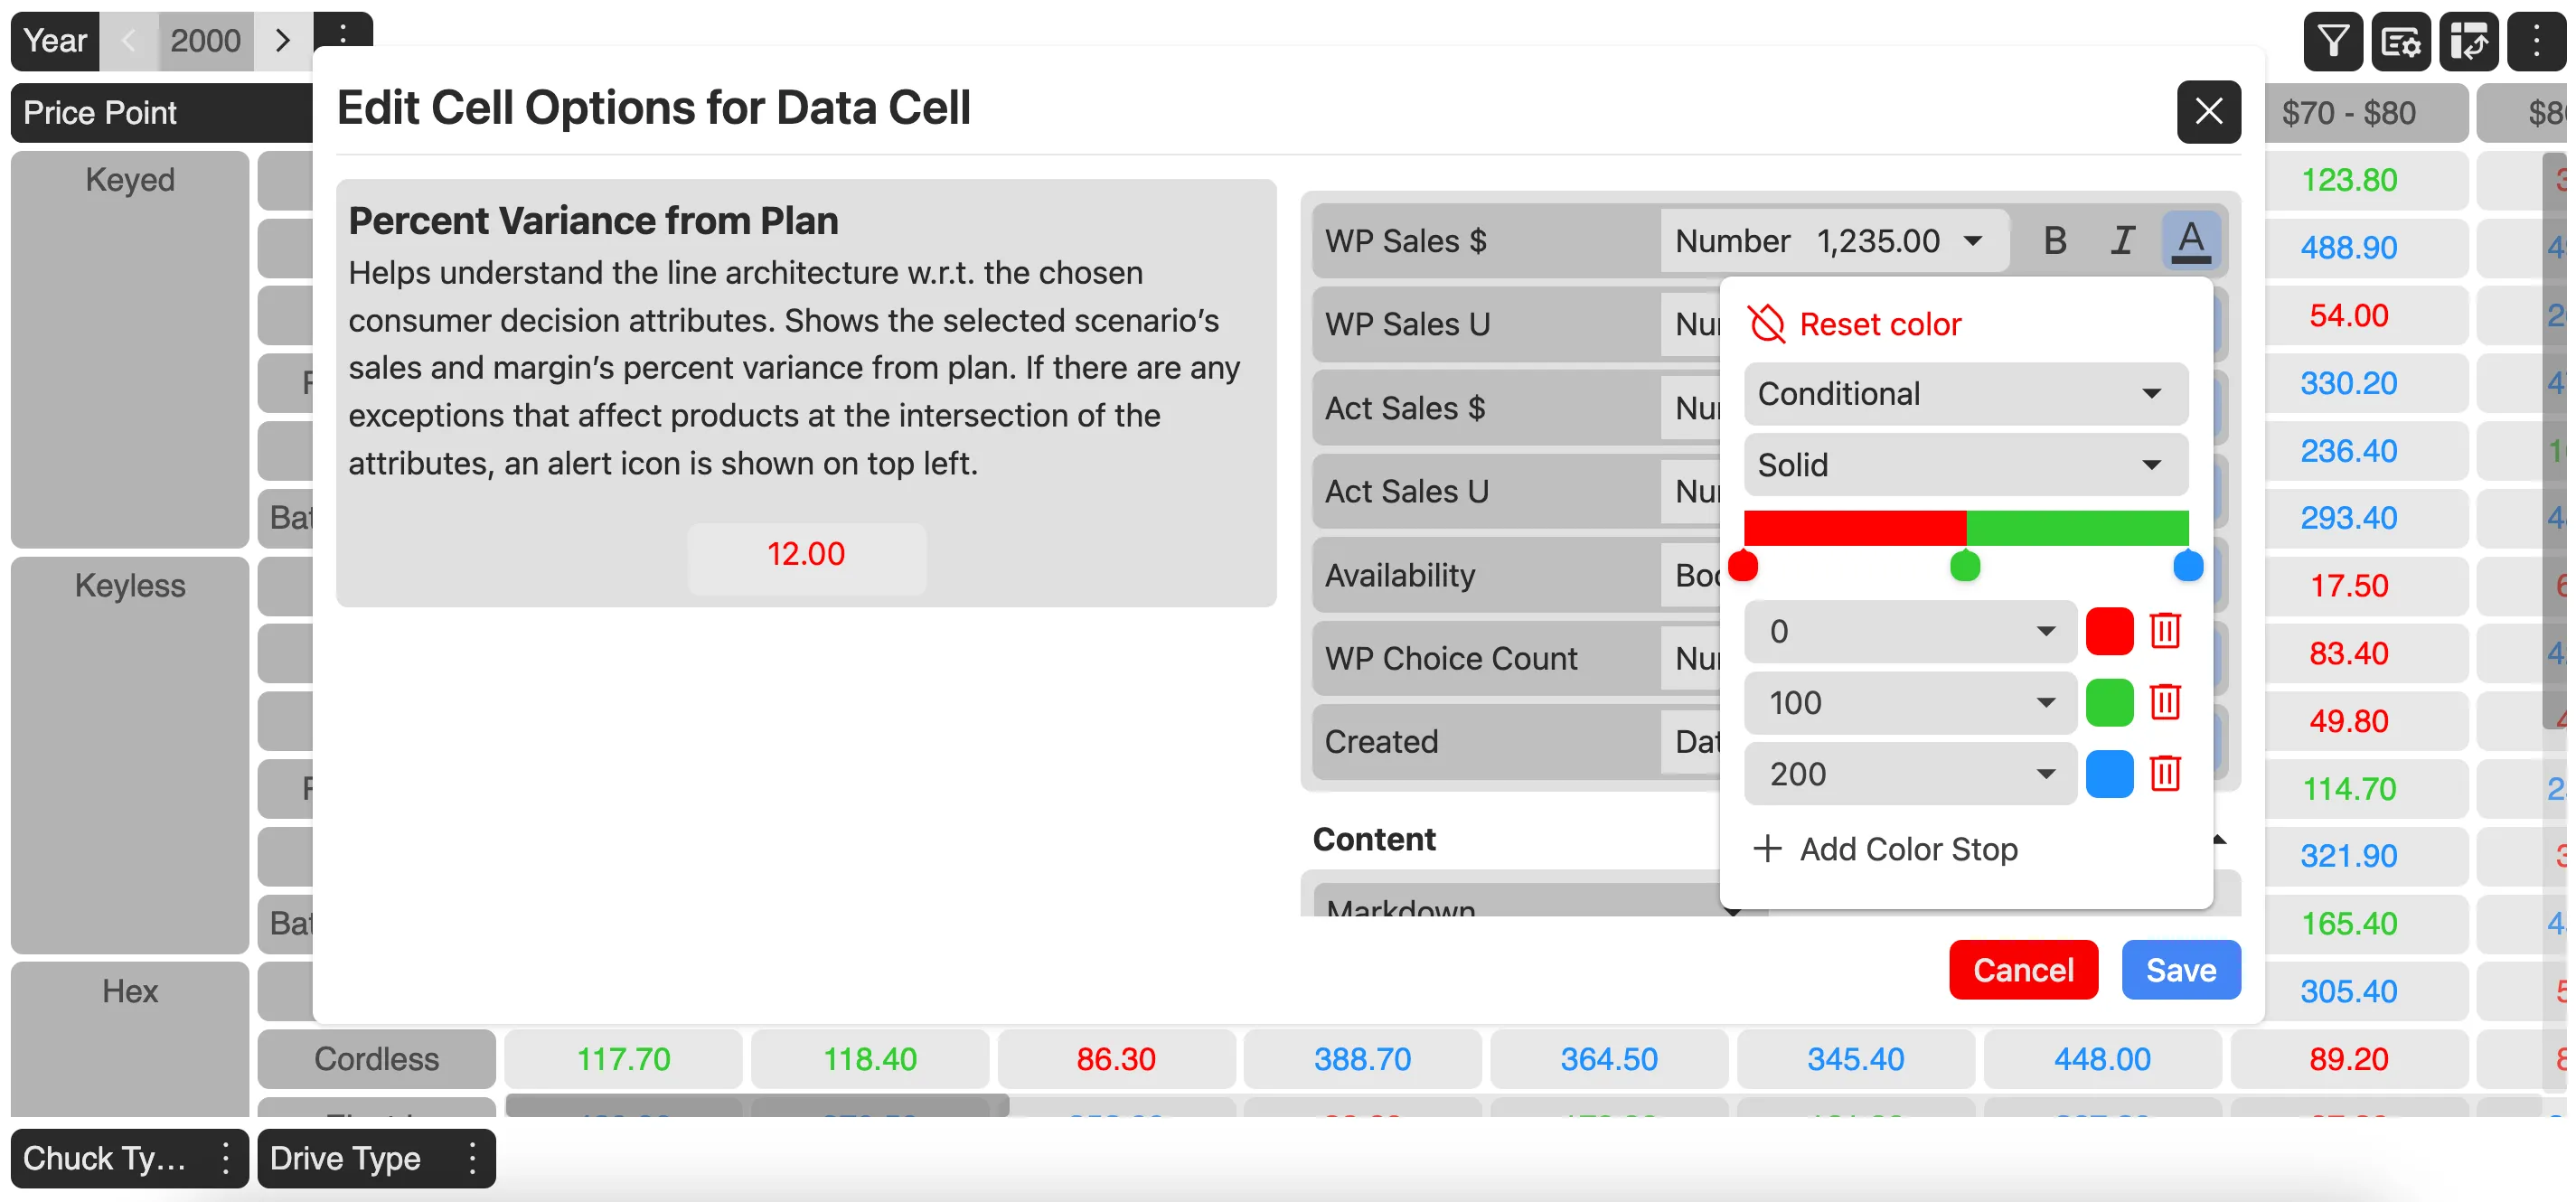
Conditional formatting helps to bring attention to specific data points based on defined rules, making it easier to analyze and interpret large data sets.
MDC Grid provides the ability to have different colors based on a different range of points.
For example, in the image given below, one could state red color for value ranging upto 100, green from 100 to 200 and blue for anything above 200. This is based on static conditional formatting of measure values.
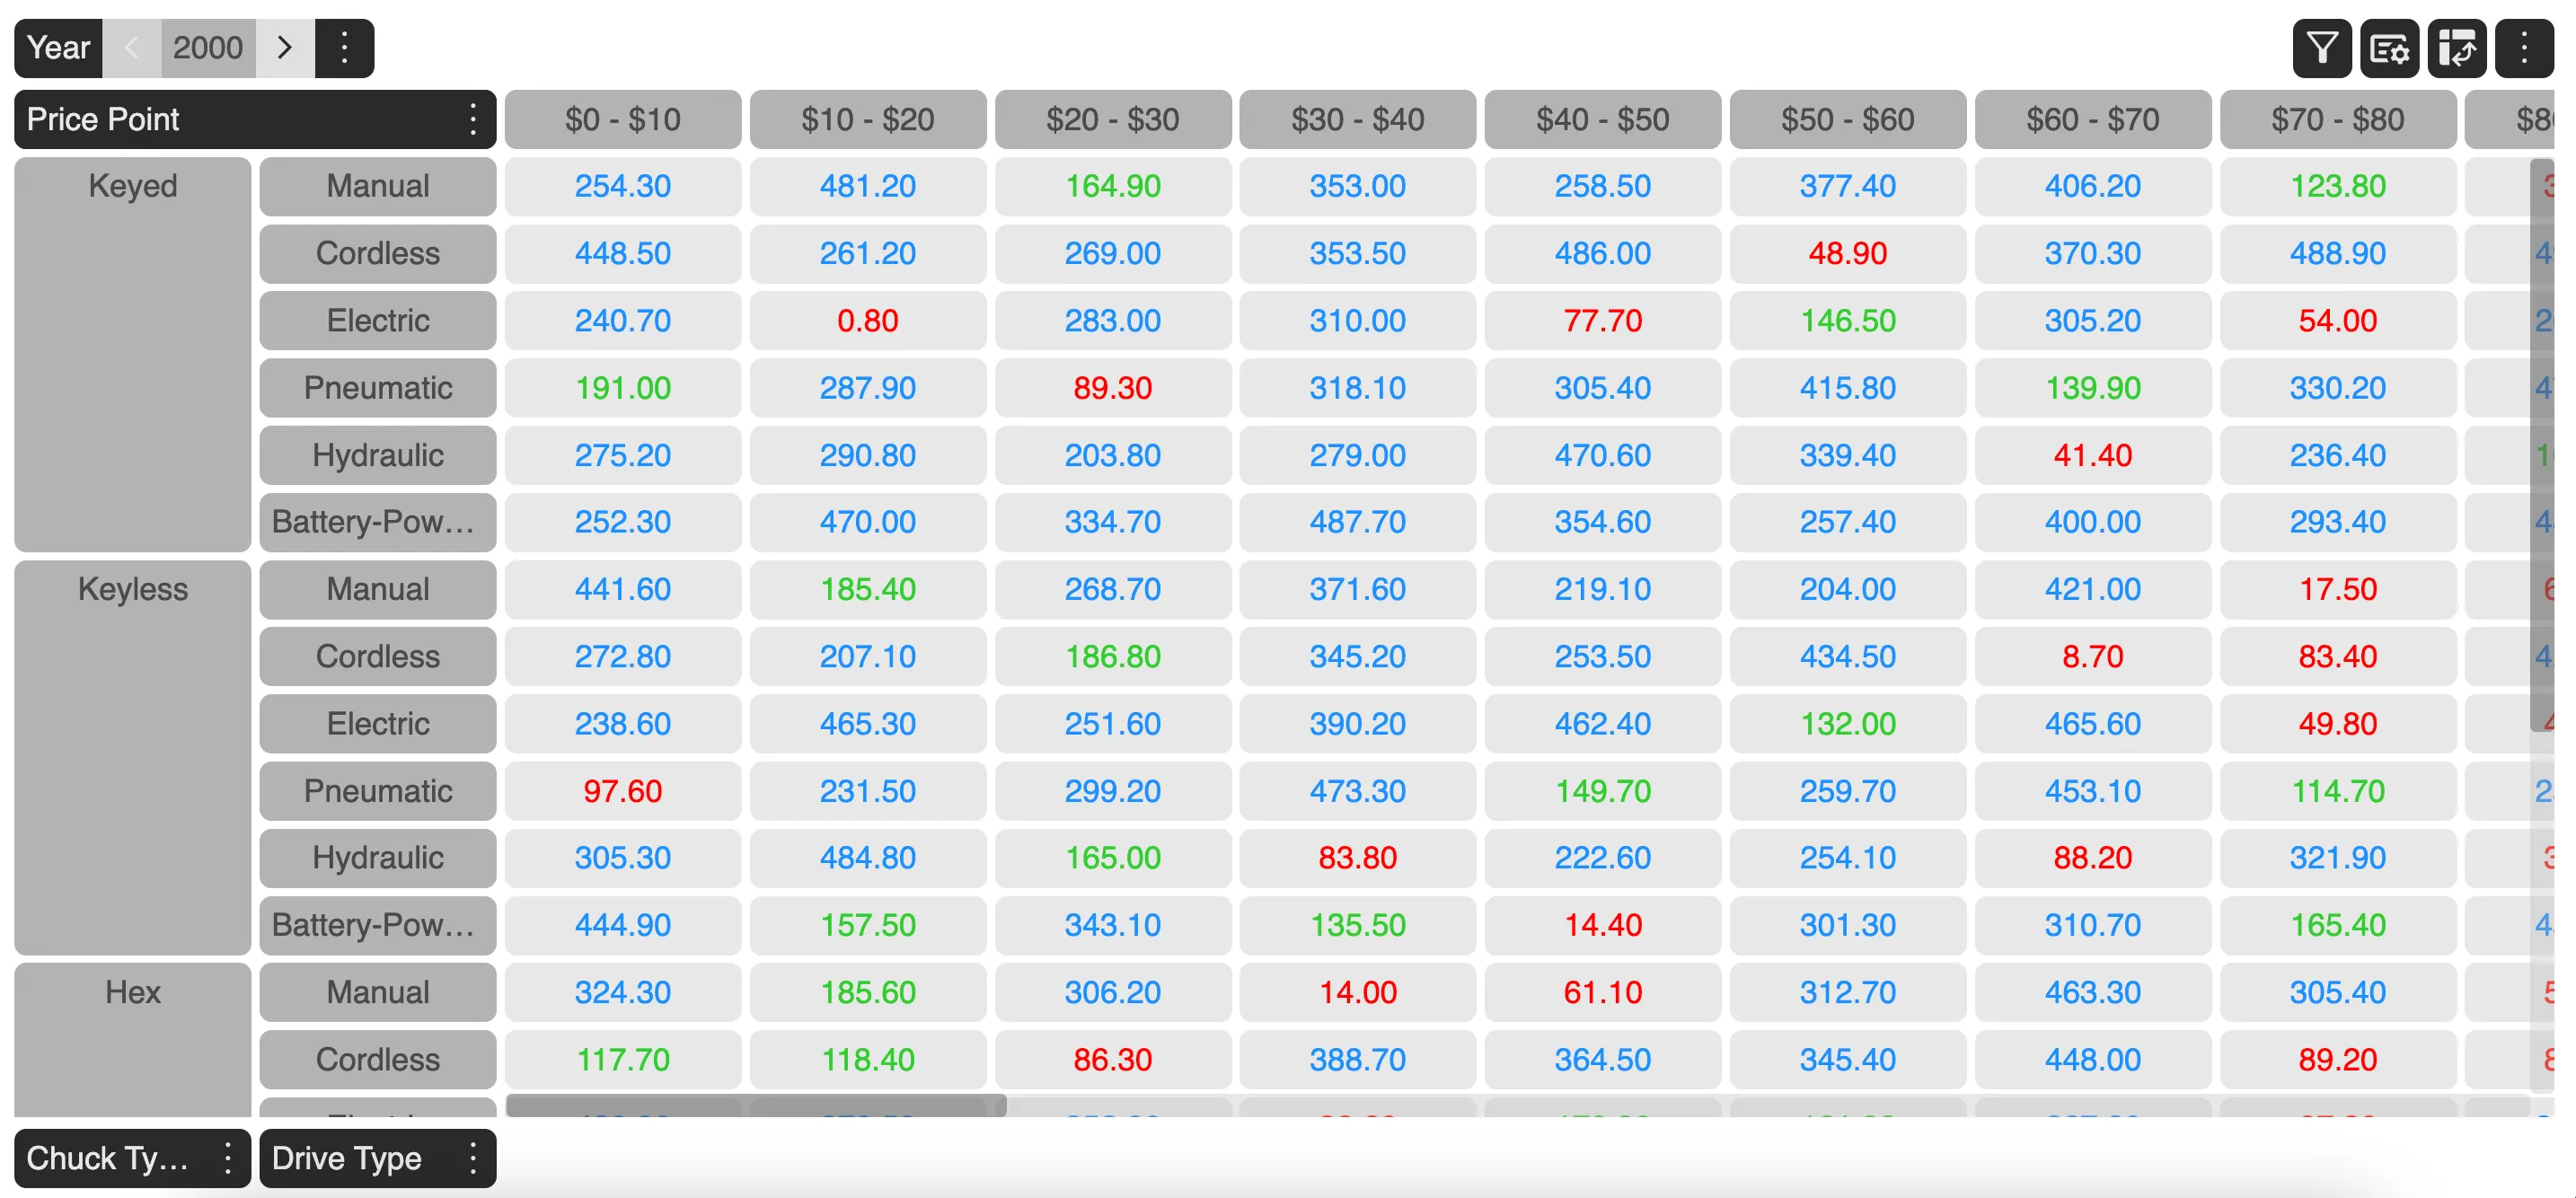
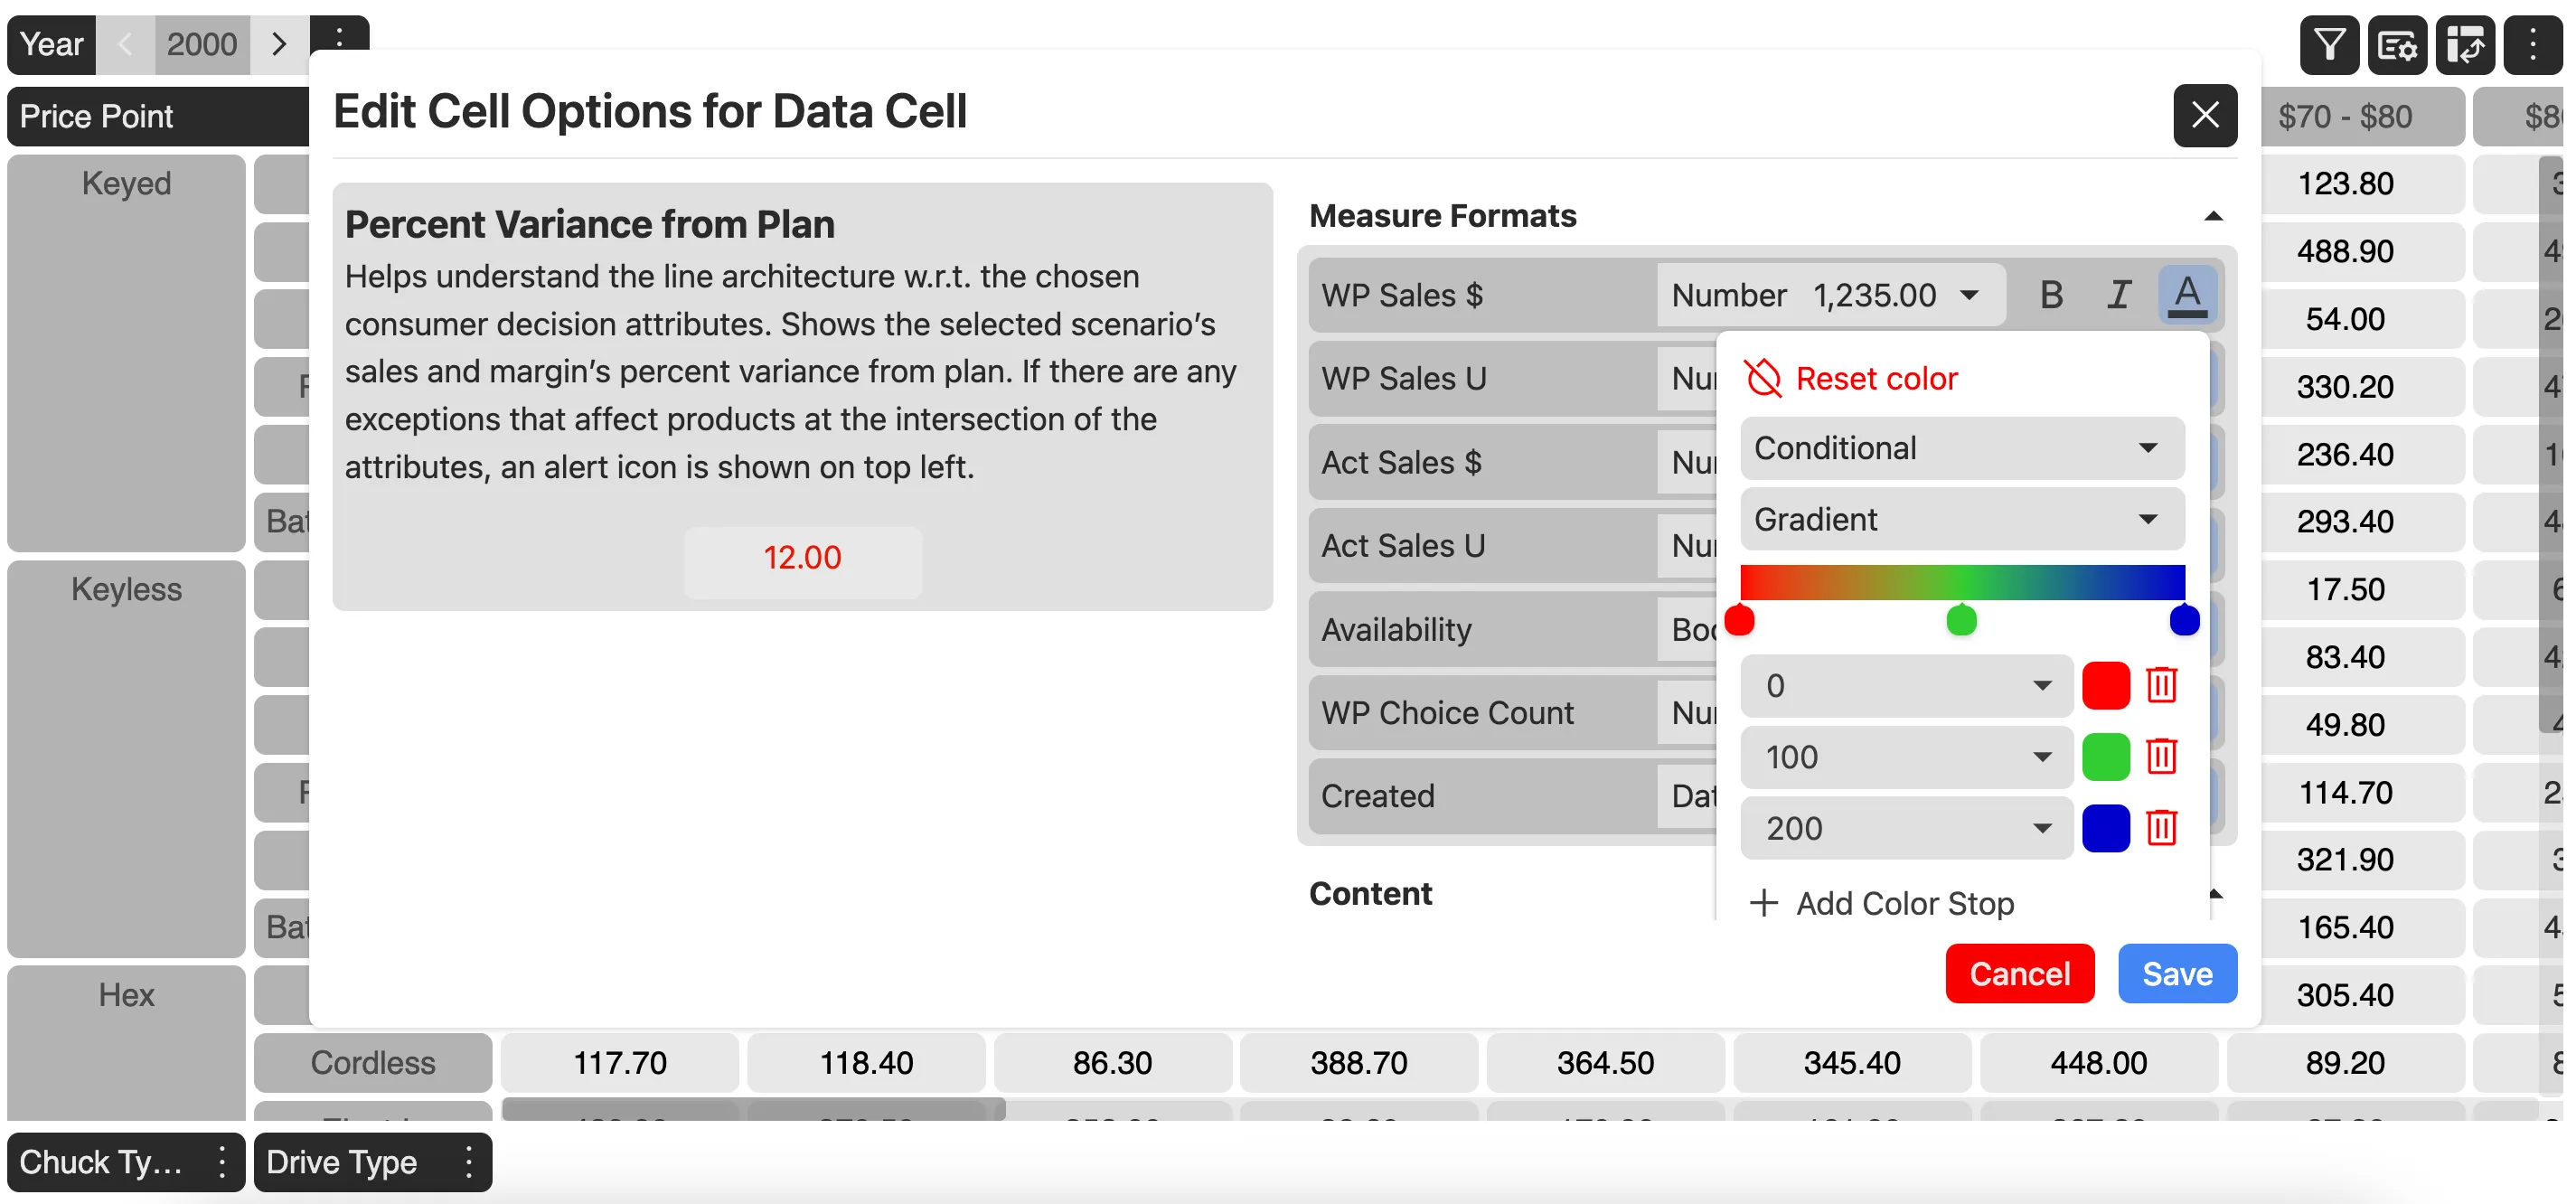
Similarly, Gradient conditional formatting is a useful feature that helps to visually represent data with a gradient color scale. This allows you to see patterns and differences in your data at a glance.
The major use cases for conditional formatting are:
- Visualizing Performance: Apply a gradient to sales figures to see which sales are the highest and lowest.
- Highlighting Temperature Ranges: Use a color gradient to represent temperature variations across a dataset.
- Financial Data: Use gradient formatting to highlight profit margins where higher values have a more intense color.
Value formatting
One can format cell values to display in scientific notation, percentage, or custom formats based on your needs. These formatting options helps to make data more readable and tailored to specific needs, enhancing your ability to analyze and present information effectively.
Different value formatting options provided by the MDC grid are:
- Number: Displays value in decimal format with decimal value ranging upto 2 places.
- Scientific Notation: Displays numbers in exponential form, useful for very large or very small numbers.
- Percentage: Multiplies the cell value by 100 and adds a percentage sign, useful for representing ratios or proportions.
- Accounting: Aligns currency symbols and decimal points for better readability. Negative numbers are often enclosed in parentheses.
- Financial: It helps to handle currency values, aligning numbers, and displaying negative amounts in a way that’s consistent with financial reporting standards.
- Currency: Displays numerical values as monetary amounts, typically including a currency symbol, thousands separators, and decimal places.
- Currency rounded: It adjusts monetary values to a specified number of decimal places and then displays it.
- Date: Displays date values in the form of MM/YY/DDDD.
- Time: Displays date values in the form of HH:MM:SS AM/PM
- Date and Time: Displays date values in the form of MM/YY/DDDD HH:MM:SS AM/PM
- Custom Formatting: Allows you to create specific formats using codes, offering flexibility in how data is displayed.
Cell Background
Changing the cell background can help highlight important information, categorize data, or improve the visual appeal of the grid.
Background of a cell can be applied on the basis of measure values or calculated values based on the calculation and thus, one may see different background colors for a different set of values.
MDC Grid gives the ability to have provide static or conditionally static or conditionally gradient background colors to the cells.
For example, a grid having a measure value of WP Sales U greater than 200 to have a red gradient background than a one with upto value of 200 to have a yellow background would result in the following:
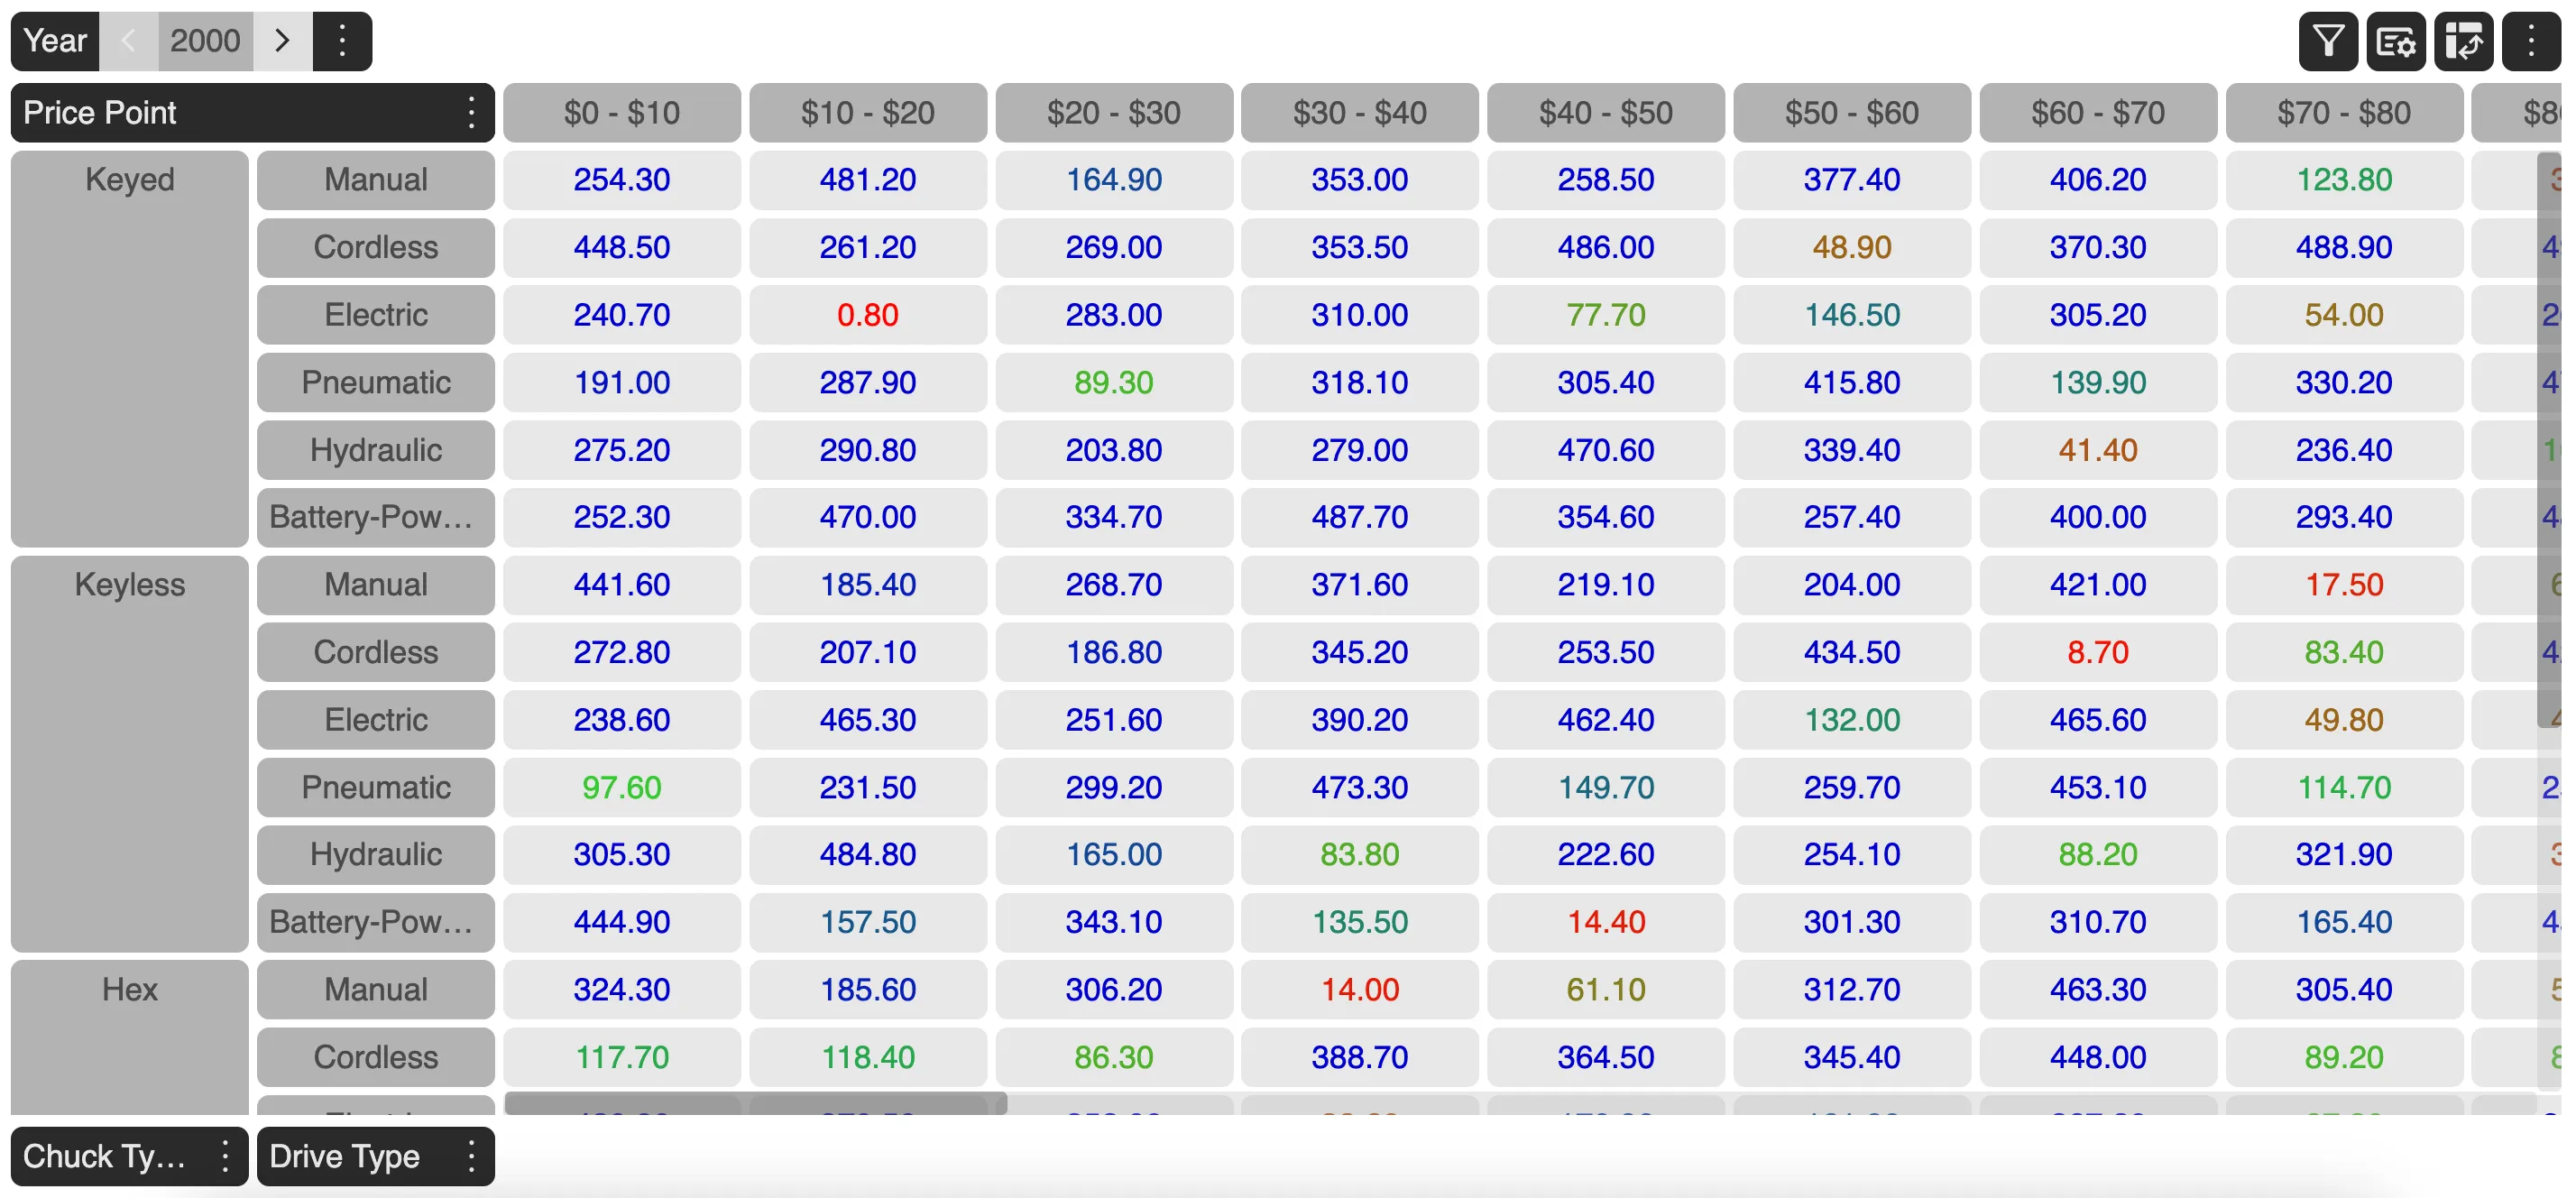
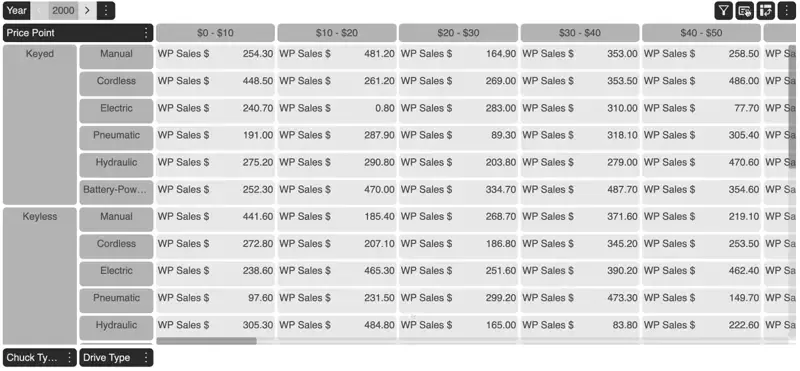
Cell Visibility
MDC Grid gives the user the ability to hide certain cells conditionally, that is, either through a non-zero value of a measure or a calculation.
Example
- Based on a measure value
Grid hides those data grid cells where measure
WP Sales Uis zero. // Grid result - Based on a calculation
For a calculation,
Sales > 200whose expression isWP Sales U > 200results in the grid hiding those data grid cells where measureWP Sales Uvalue is less than or equal to 200.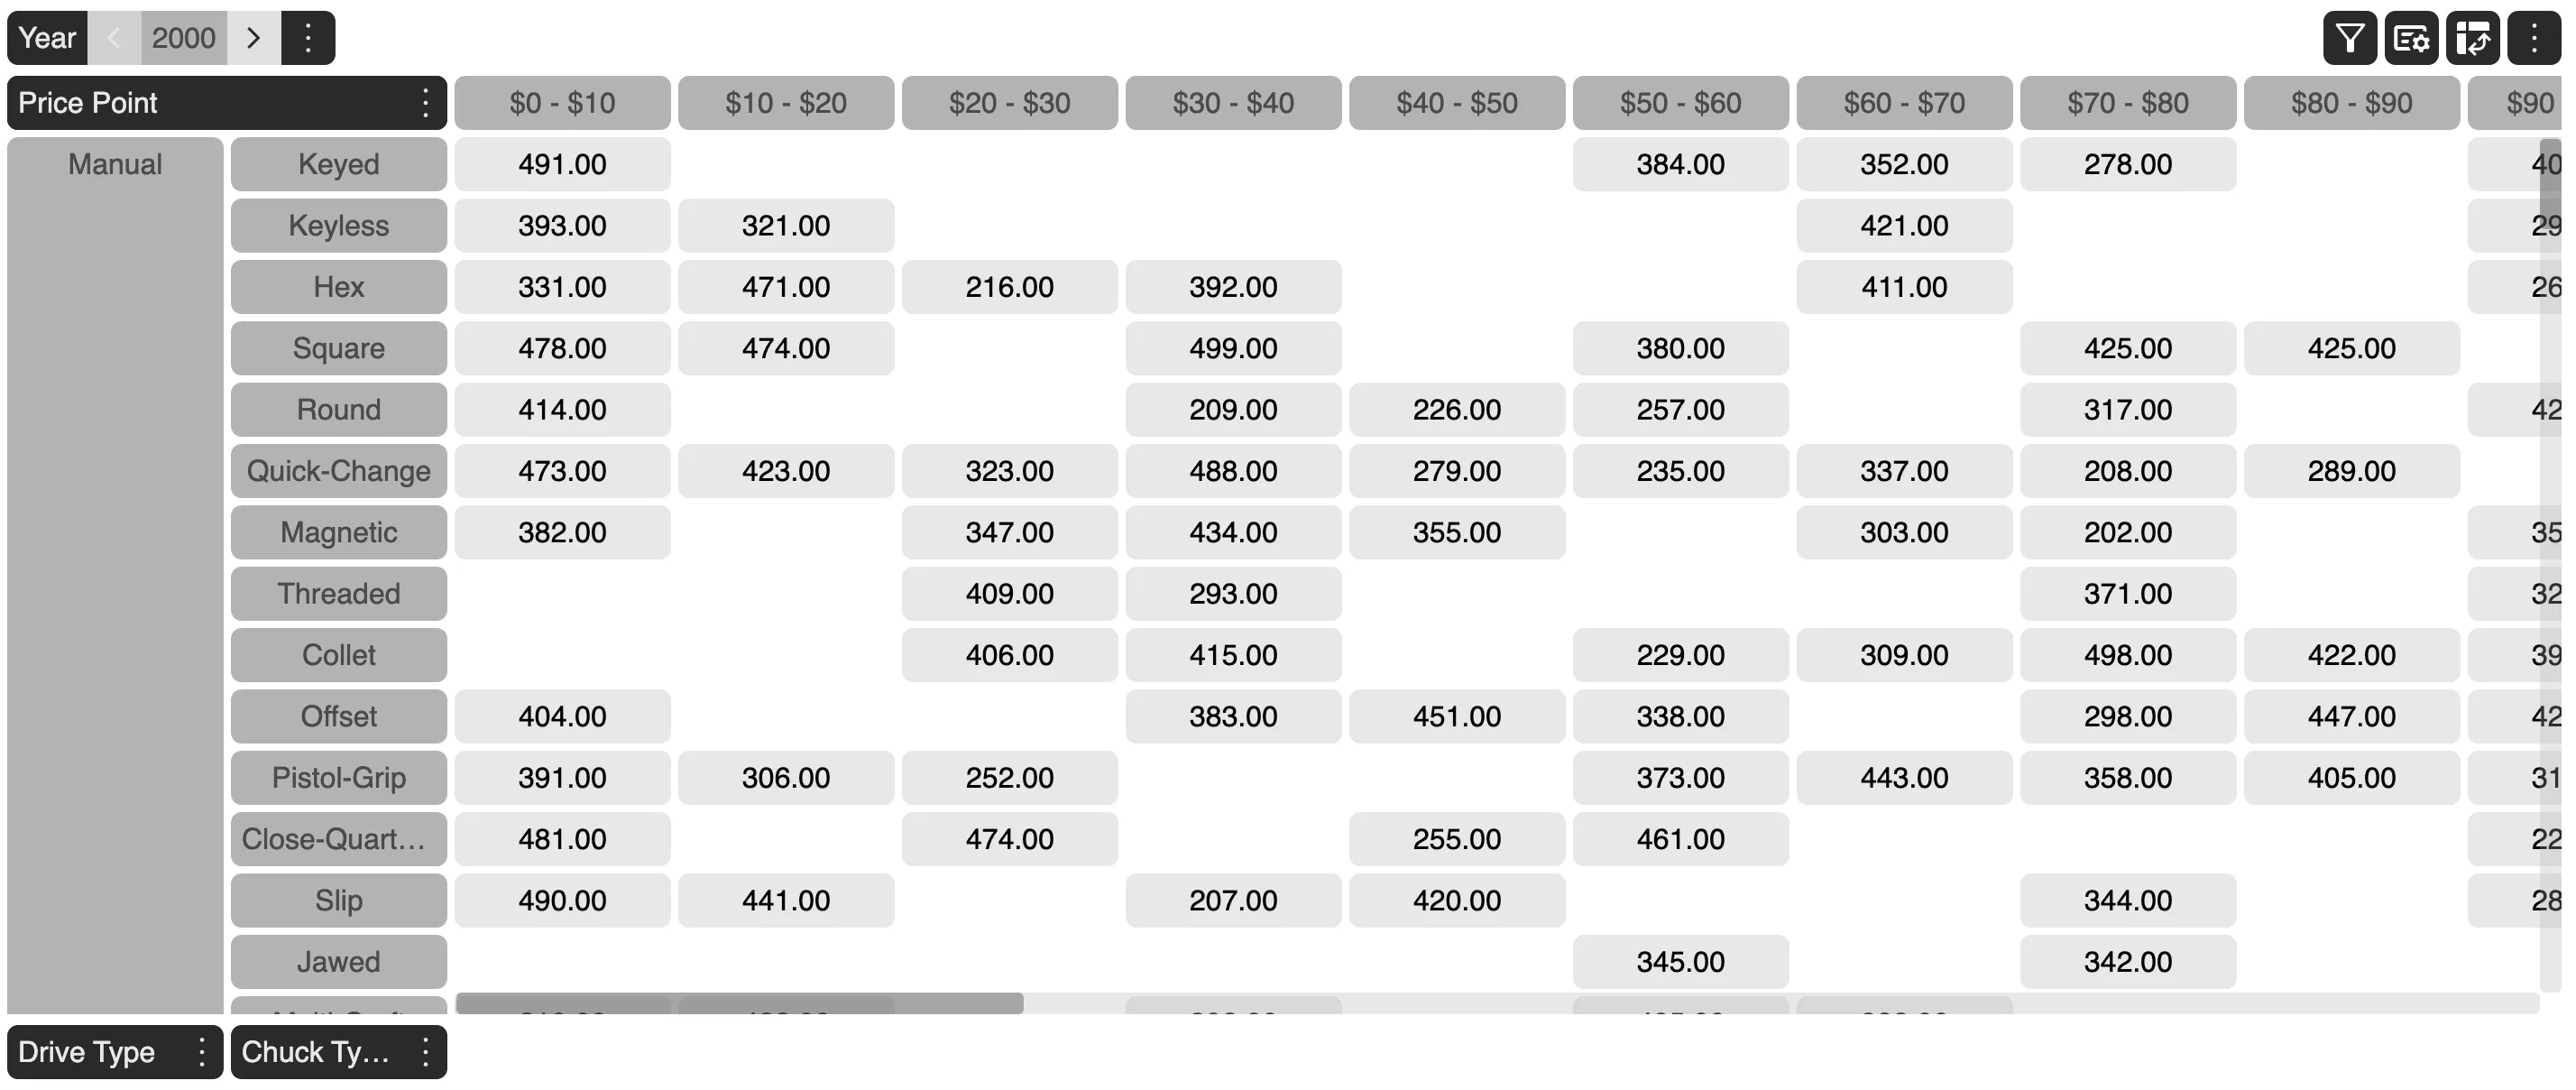
Icons
Using icons in a multi-dimensional grid can significantly enhance the visual representation of data, making it easier to interpret and analyze. Icons can be used for various purposes such as representing data trends, indicating statuses, or providing visual cues for complex datasets.
Icons are displayed either when a measure selected has a non-zero value or the resultant value of a calculation is truthy.
MDC Grid provides a set of icons that could be displayed in a cell. At any given point of time, it allows the user to control how many number of icons can be displayed in a cell.
For example, if a user states that only 3 icons could be displayed in a cell at any given time and the user has added 5 icons in the cell option applied. Then each criteria is evaluated fro top-to-bottom and the top 3 icons whose criteria matches are displayed on the cell. So, you could add more than the number of icons to be displayed and the grid handles which one to display depending on the priority set.
![]()
![]()
Test Data
To test out the applied changes made to the cell option, one can provide the test values to the measures and see how the cell reacts to those changes and how it’s appearance or visibility would change corresponding to those values.
// Test Data screenshot